
PUBLISHER: Mordor Intelligence | PRODUCT CODE: 2035018

PUBLISHER: Mordor Intelligence | PRODUCT CODE: 2035018
Building Management System - Market Share Analysis, Industry Trends & Statistics, Growth Forecasts (2026 - 2031)
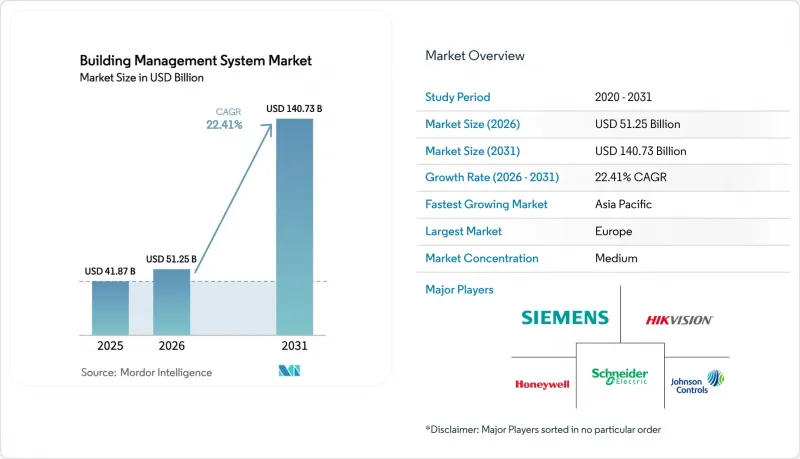
The Building Management System Market size was valued at USD 41.87 billion in 2025 and estimated to grow from USD 51.25 billion in 2026 to reach USD 140.73 billion by 2031, at a CAGR of 22.41% during the forecast period (2026-2031).
Expanding smart-city budgets, stricter net-zero rules, and post-pandemic health priorities are accelerating digital modernization across new and existing facilities. Vendors that pair AI with cloud-native software gain an edge because predictive analytics lower energy bills and extend equipment life. Hardware remains essential, yet the fastest gains come from software modules that orchestrate sensors, controllers, and third-party devices through open protocols. Consolidation continues as established HVAC and automation suppliers acquire AI specialists to deliver unified platforms that meet regional compliance targets.
Global Building Management System Market Trends and Insights
Rapid smart-city investments
Municipal spending on smart-city ICT exceeded USD 63.4 billion between 2014 and 2023, and a sizable share funnels into building automation platforms that aggregate energy, occupancy, and safety data for urban dashboards. Venture funding in smart-building start-ups reached USD 6.9 billion in 2024, underscoring investor confidence that connected buildings form the digital backbone of smart-city ecosystems. Singapore's Smart Nation initiative already connects more than 100,000 sensors in public and private buildings to enable real-time load balancing and comfort optimization. Barcelona's adaptive street-lighting program uses building-linked controls to lower municipal energy costs by 30% while improving nighttime safety. These projects validate the return on integrated platforms and accelerate regional demand for interoperable building management solutions.
Sustainability and net-zero mandates
The European Union requires all new buildings to achieve zero operational emissions by 2030, a rule that pushes owners to adopt automation capable of measuring and correcting energy deviations in real time. France's RE2020 law sets embodied-carbon ceilings that fall every three years until 2031, encouraging continuous monitoring of construction and operational emissions. Only eight EU states fully met nearly-zero-energy-building targets by 2024, highlighting a shortfall that advanced automation can close. Climate-aligned bonds now require live performance data to verify decarbonization pathways, creating a financing advantage for facilities equipped with granular energy-management modules. These policies collectively elevate the building management system market because automated reporting and demand-response functions become prerequisites for capital access and occupancy permits.
High upfront CAPEX
Turn-key building management projects range from USD 50,000 for small facilities to more than USD 1 million for multi-building campuses, putting pressure on cash-flow-focused owners. Upcoming EPA refrigerant rules are adding 10-30% to HVAC replacement costs, stretching budgets that could cover automation. Semiconductor shortages still inflate controller lead times, forcing owners to stock spares or absorb delays. Payback periods average 21 months, acceptable to corporates yet tight for smaller enterprises. Financing models such as energy-performance contracts and green bonds are easing adoption, but high CAPEX remains a near-term drag on the building management system market.
Other drivers and restraints analyzed in the detailed report include:
- Post-pandemic healthy-building certifications
- Declining IoT-sensor and wireless-network costs
- Cybersecurity risks in OT networks
For complete list of drivers and restraints, kindly check the Table Of Contents.
Segment Analysis
The building management system market recorded a 42.18% hardware share in 2025, reflecting widespread use of controllers, sensors, and gateways that handle real-time field tasks. Software revenue, though smaller, is climbing at a 25.05% CAGR because cloud dashboards and AI toolkits unlock predictive functions once the hardware baseline is in place. Services-including integration, remote monitoring, and cyber-security audits-form the fastest-rising revenue stream as owners outsource complex lifecycle tasks to specialists. Edge computing chips store local algorithms, safeguarding operations whenever the site loses connectivity. Competitive dynamics now revolve around software differentiation rather than proprietary devices, steering investment toward open-API platforms.
Building operators highlight condensed commissioning cycles when software auto-discovers devices and maps point data. Siemens retrofit packages, for example, slash project timelines by linking edge controllers to a no-code cloud studio that visualizes energy drift within hours of connection. Pricing pressure on commodity sensors means vendors must grow via analytics subscriptions, not mark-ups on physical parts. Over the forecast period, the building management system market will therefore see hardware margins contract while software sticks above 20%, validating a shift toward outcome-based service contracts.
Facility-management suites led with a 32.10% share of the building management system market size in 2025, bundling work-order tools, asset logs, and compliance reports. Energy-management modules, however, are expanding at 27.15% CAGR as corporate climate pledges require granular monitoring of kilowatt-hours and emissions. New releases combine machine-learning engines with weather APIs to shave peak demand charges without affecting occupant comfort. Infrastructure and emergency modules grow steadily in mission-critical sites that require centralized generator, fire, and evacuation oversight. Security dashboards converge access control and video analytics in a single pane, reducing operator workload.
Analytics-rich platforms now benchmark actual usage against Energy Use Intensity targets and issue alerts when deviations exceed 5%. The Carl T. Hayden VA Medical Center cut total utility bills by more than 25% after pairing chilled-water storage with predictive scheduling that flatten peak loads. Over the forecast period, owners seeking climate-bond financing will favor products that align with global reporting frameworks, locking energy-management functions into every major procurement.
The Building Management System Market Report Segments the Industry Into Component (Hardware, Software, and Services), Software Module (Facility Management, Security Management, Energy Management, and More), Deployment Type (On-Premise, Cloud-Based), Communication Protocol (BACnet, Modbus, KNS, and More), End-User Industry (Residential Buildings, Commercial Buildings, and More), and Geography.
Geography Analysis
Europe generated the largest regional revenue, holding 39.00% of the building management system market in 2025. EU zero-emission mandates and nearly-zero-energy-building rules turn automation from a discretionary upgrade into a planning prerequisite. France's RE2020 carbon caps tighten every three years, compelling developers to adopt sub-metering and AI scheduling to remain within limits. Germany, the United Kingdom, and the Nordics deploy heat-pump-centric controls that combine weather forecasting with real-time energy pricing to maintain comfort at minimal cost. Established integrators supply turnkey retrofits that demonstrate double-digit IRRs, making automation a mainstream line item in refurbishment budgets.
Asia-Pacific is the fastest-growing region in the building management system market, forecast at a 26.10% CAGR. China pours municipal funds into IoT-ready districts that treat each building as a node in a larger grid-interactive system. India's urban population surge doubles electricity demand, pushing states to adopt building codes that mandate smart controls for cooling efficiency. Singapore's nation-wide sensor rollout proves the feasibility of granular oversight, inspiring similar programs in Kuala Lumpur and Bangkok. Japan and South Korea leverage semiconductor prowess to embed AI at the edge, shrinking latency for elevator dispatch and security analytics. Regional suppliers partner with global majors to localize software for language and compliance, further expanding the building management system market.
North America maintains sizeable volume through healthcare upgrades, campus modernizations, and residential electrification. U.S. federal tax incentives reimburse up to 30% of qualified efficiency investments, motivating owners to add advanced controls during HVAC swaps. Canada emphasizes cold-climate optimization, while Mexico accelerates adoption in its growing industrial corridors. Despite slower growth than APAC, rising healthy-building standards and decarbonization pledges sustain steady spending across the continent.
- Johnson Controls International plc
- Schneider Electric SE
- Siemens AG
- Honeywell International Inc.
- Trane Technologies plc
- Carrier Global Corporation
- ABB Ltd.
- Delta Controls Inc.
- Automated Logic Corporation
- Distech Controls Inc.
- Crestron Electronics, Inc.
- Cisco Systems, Inc.
- IBM Corporation
- Convergint Technologies LLC
- Legrand SA
- BuildingIQ, Inc.
- KMC Controls, Inc.
- Bosch Security Systems GmbH
- ENGIE SA (Cofely Services)
- Rexel Group
Additional Benefits:
- The market estimate (ME) sheet in Excel format
- 3 months of analyst support
TABLE OF CONTENTS
1 INTRODUCTION
- 1.1 Study Assumptions and Market Definition
- 1.2 Scope of the Study
2 RESEARCH METHODOLOGY
3 EXECUTIVE SUMMARY
4 MARKET LANDSCAPE
- 4.1 Market Overview
- 4.2 Market Drivers
- 4.2.1 Rapid smart-city investments
- 4.2.2 Sustainability and Net-Zero compliance mandates
- 4.2.3 Post-pandemic healthy-building certifications
- 4.2.4 Declining IoT-sensor and wireless-network costs enabling retrofits
- 4.2.5 AI-driven predictive-maintenance ROI proofs
- 4.2.6 Green-bond financing tied to building-performance KPIs
- 4.3 Market Restraints
- 4.3.1 High upfront CAPEX
- 4.3.2 Cyber-security risks in OT networks
- 4.3.3 Fragmented legacy-building protocol interoperability
- 4.3.4 Vendor-proprietary lock-in limiting open standards
- 4.4 Evaluation of Critical Regulatory Framework
- 4.5 Value Chain Analysis
- 4.6 Technological Outlook
- 4.7 Porter's Five Forces
- 4.7.1 Bargaining Power of Suppliers
- 4.7.2 Bargaining Power of Buyers
- 4.7.3 Threat of New Entrants
- 4.7.4 Threat of Substitutes
- 4.7.5 Competitive Rivalry
- 4.8 Impact Assessment of Key Stakeholders
- 4.9 Key Use Cases and Case Studies
- 4.10 Impact on Macroeconomic Factors of the Market
- 4.11 Investment Analysis
5 MARKET SEGMENTATION
- 5.1 By Component
- 5.1.1 Hardware
- 5.1.2 Software
- 5.1.3 Services
- 5.2 By Software Module
- 5.2.1 Facility Management
- 5.2.2 Security Management
- 5.2.3 Energy Management
- 5.2.4 Infrastructure Management
- 5.2.5 Emergency Management
- 5.3 By Deployment Type
- 5.3.1 On-Premise
- 5.3.2 Cloud-Based
- 5.4 By Communication Protocol
- 5.4.1 BACnet
- 5.4.2 Modbus
- 5.4.3 KNX
- 5.4.4 LonWorks
- 5.4.5 Zigbee
- 5.4.6 Wi-Fi / IP-Based
- 5.4.7 Proprietary Protocols
- 5.5 By End-Use Industry
- 5.5.1 Residential Buildings
- 5.5.2 Commercial Buildings
- 5.5.3 Industrial Facilities
- 5.5.4 Public / Government Buildings
- 5.5.5 Healthcare Facilities
- 5.5.6 Education Campuses
- 5.6 By Geography
- 5.6.1 North America
- 5.6.1.1 United States
- 5.6.1.2 Canada
- 5.6.1.3 Mexico
- 5.6.2 South America
- 5.6.2.1 Brazil
- 5.6.2.2 Argentina
- 5.6.2.3 Rest of South America
- 5.6.3 Europe
- 5.6.3.1 United Kingdom
- 5.6.3.2 Germany
- 5.6.3.3 France
- 5.6.3.4 Italy
- 5.6.3.5 Spain
- 5.6.3.6 Nordics
- 5.6.3.7 Rest of Europe
- 5.6.4 Middle East and Africa
- 5.6.4.1 Middle East
- 5.6.4.1.1 Saudi Arabia
- 5.6.4.1.2 United Arab Emirates
- 5.6.4.1.3 Turkey
- 5.6.4.1.4 Rest of Middle East
- 5.6.4.2 Africa
- 5.6.4.2.1 South Africa
- 5.6.4.2.2 Egypt
- 5.6.4.2.3 Nigeria
- 5.6.4.2.4 Rest of Africa
- 5.6.4.1 Middle East
- 5.6.5 Asia-Pacific
- 5.6.5.1 China
- 5.6.5.2 India
- 5.6.5.3 Japan
- 5.6.5.4 South Korea
- 5.6.5.5 ASEAN
- 5.6.5.6 Australia
- 5.6.5.7 New Zealand
- 5.6.5.8 Rest of Asia-Pacific
- 5.6.1 North America
6 COMPETITIVE LANDSCAPE
- 6.1 Market Concentration
- 6.2 Strategic Moves
- 6.3 Market Share Analysis
- 6.4 Company Profiles (includes Global level Overview, Market level overview, Core Segments, Financials as available, Strategic Information, Market Rank/Share for key companies, Products and Services, and Recent Developments)
- 6.4.1 Johnson Controls International plc
- 6.4.2 Schneider Electric SE
- 6.4.3 Siemens AG
- 6.4.4 Honeywell International Inc.
- 6.4.5 Trane Technologies plc
- 6.4.6 Carrier Global Corporation
- 6.4.7 ABB Ltd.
- 6.4.8 Delta Controls Inc.
- 6.4.9 Automated Logic Corporation
- 6.4.10 Distech Controls Inc.
- 6.4.11 Crestron Electronics, Inc.
- 6.4.12 Cisco Systems, Inc.
- 6.4.13 IBM Corporation
- 6.4.14 Convergint Technologies LLC
- 6.4.15 Legrand SA
- 6.4.16 BuildingIQ, Inc.
- 6.4.17 KMC Controls, Inc.
- 6.4.18 Bosch Security Systems GmbH
- 6.4.19 ENGIE SA (Cofely Services)
- 6.4.20 Rexel Group
7 MARKET OPPORTUNITIES AND FUTURE OUTLOOK
- 7.1 White-space and Unmet-need Assessment

