
PUBLISHER: Mordor Intelligence | PRODUCT CODE: 2035020

PUBLISHER: Mordor Intelligence | PRODUCT CODE: 2035020
Cloud Native - Market Share Analysis, Industry Trends & Statistics, Growth Forecasts (2026 - 2031)
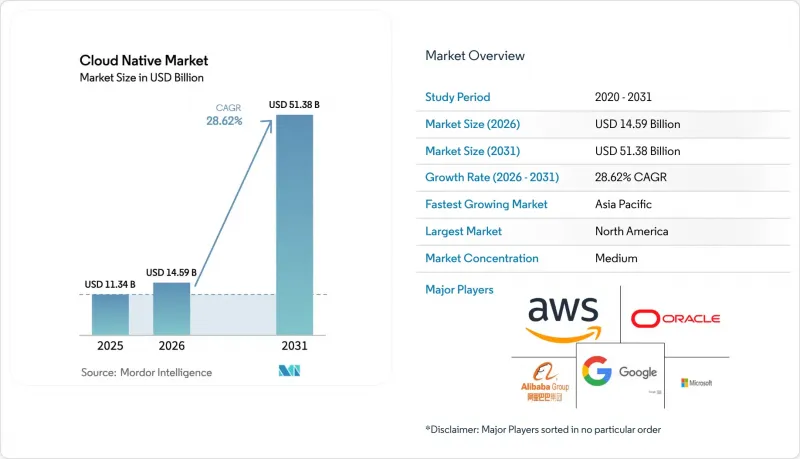
The cloud native market size is expected to grow from USD 11.34 billion in 2025 to USD 14.59 billion in 2026 and is forecast to reach USD 51.38 billion by 2031 at 28.62% CAGR over 2026-2031.
Growth accelerators include platform engineering adoption, Kubernetes-native data services, and the surge of generative-AI workloads that now drive half of cloud infrastructure expansion. GPU consumption for AI training has risen 336% year-over-year at Oracle, illustrating how specialized compute reshapes infrastructure demand. Enterprises use these technologies to maintain hybrid consistency, reduce vendor lock-in, and satisfy rising sovereign-cloud compliance. Public cloud keeps its lead, yet hybrid and multi-cloud patterns grow faster as organizations seek workload portability and data-localization conformity.
Global Cloud Native Market Trends and Insights
Generative-AI-driven workload explosion
Specialized compute for large language models forces redesign of application architectures around containers that can scale inference across heterogeneous hardware. Oracle's 336% GPU-use surge underscores the magnitude of demand for AI-ready capacity. WebAssembly runtimes achieve 35.4 microsecond start-up times, enabling near-native performance for micro-services and ML inference. Platform teams now pair wasmCloud with distributed ML frameworks to cut latency from edge to core while keeping security isolation. Standardisation momentum is visible in the CNCF's 2025 release of Dapr AI Agents, which reduces orchestration complexity for multi-cloud AI deployments.
Enterprise shift to platform engineering teams
Platform engineering abstracts infrastructure complexity and promotes secure self-service. Adoption reached 55% of organisations, with 90% planning expansion. Graduated CNCF projects such as cert-manager automate certificate life-cycles, cutting manual security overhead. Vendors weave AI assistance into these platforms; Red Hat and Stability AI integrated generative tooling into OpenShift, aiming at productivity gains and cost control.
Exit-strategy and repatriation cost shock
Eighty-three to 86% of CIOs plan some workload shifts, yet hidden extraction costs often eclipse forecast savings. Dependencies on cloud-native services mean that data movement, redesign of integrations, and new hardware investments offset repatriation gains. Firms now design for portability from day-one using open-source orchestration and database operators to protect future exit options.
Other drivers and restraints analyzed in the detailed report include:
- Kubernetes-native data services maturation
- Hyperscaler sovereign-cloud programmes
- Shortage of cloud-native security talent
For complete list of drivers and restraints, kindly check the Table Of Contents.
Segment Analysis
Services are forecast to expand at 32.04% CAGR through 2031 as enterprises outsource managed Kubernetes, security monitoring, and lifecycle operations. Platforms maintained 55.10% cloud native market share in 2025, but the steep rise of services shows preference for vendor expertise when internal complexity grows. Red Hat's estimated USD 5-10 billion annual hybrid cloud revenue underlines demand for integrated software and advisory bundles.
The services wave intersects with platform engineering adoption because 75-80% of organisations intend to form dedicated teams. Consulting and managed offerings help design, build, and run these platforms, letting customers keep focus on product delivery. Vendors embed AI into support layers, allowing proactive optimisation. This blend of automation and service know-how sustains the cloud native market growth trajectory.
Public cloud held 61.05% of revenue in 2025, yet hybrid and multi-cloud segments will grow 34.06% CAGR to 2031. Organisations use multi-provider strategies to avoid lock-in and meet localisation rules, a pattern validated by Oracle's 115% sequential jump in MultiCloud database revenue. Sovereign programmes from yperscalers align with this trend, packaging compliance controls with familiar services.
Private cloud remains crucial for industries needing on-premises data, but they increasingly adopt cloud-native tooling for parity with public services. Hybrid control planes unify operational experience, trimming skills gaps and speeding deployment. These factors reinforce demand across every deployment category and widen the overall cloud native market.
Global Cloud Native Market is Segmented by Component (Platforms, Services), Deployment Model (Public Cloud, Private Cloud, Hybrid/Multi-Cloud), Enterprise Size (Large Enterprises, Smes), End-User Industry (BFSI, IT and Telecom, and More), and by Geography. The Market Forecasts are Provided in Terms of Value (USD).
Geography Analysis
North America contributed 41.20% of revenue in 2025 thanks to early hyperscaler penetration, a dense startup ecosystem, and robust AI spending. Strong platform engineering communities accelerate knowledge sharing and tooling maturity. Federal guidance on secure software supply chains also reinforces demand for Kubernetes-centric DevSecOps.
Asia-Pacific is the fastest-growing region with 33.88% CAGR to 2031. Localisation mandates spur sovereign-cloud offerings and domestic provider growth. China's market shows preference for Alibaba, Huawei, and Tencent, illustrating how policy shapes vendor mix. India, Indonesia, and Vietnam record double-digit expansion as digital-first initiatives leapfrog legacy infrastructure.
Europe benefits from GDPR and the EU AI Act, which push enterprises toward region-based data residency. AWS's European Sovereign Cloud investment exemplifies hyperscaler adaptation. Middle East and Africa adopt cloud native to support digital transformation projects in finance, public services, and oil-and-gas, though infrastructure gaps slow progress in some countries.
- Amazon Web Services, Inc.
- Microsoft Corporation
- Google LLC
- International Business Machines Corporation
- Oracle Corporation
- Alibaba Group Holding Limited (Alibaba Cloud)
- Tencent Cloud Computing (Beijing) Co., Ltd.
- Huawei Technologies Co., Ltd.
- VMware, Inc.
- Red Hat, Inc.
- SAP SE
- Salesforce, Inc.
- Broadcom Inc.
- Cloudflare, Inc.
- DigitalOcean Holdings, Inc.
- Snowflake Inc.
- CoreWeave, Inc.
- Infosys Limited
- Tata Consultancy Services Limited
- Capgemini SE
Additional Benefits:
- The market estimate (ME) sheet in Excel format
- 3 months of analyst support
TABLE OF CONTENTS
1 INTRODUCTION
- 1.1 Study Assumptions and Market Definition
- 1.2 Scope of the Study
2 RESEARCH METHODOLOGY
3 EXECUTIVE SUMMARY
4 MARKET LANDSCAPE
- 4.1 Market Overview
- 4.2 Market Drivers
- 4.2.1 Generative-AI-driven workload explosion
- 4.2.2 Mandatory carbon-aware cloud optimisation
- 4.2.3 Enterprise shift to platform engineering teams
- 4.2.4 Kubernetes-native data services maturation
- 4.2.5 Hyperscaler sovereign-cloud programmes
- 4.2.6 Accelerated industry-cloud blueprints (BFSI, healthcare, telco)
- 4.3 Market Restraints
- 4.3.1 Exit-strategy and repatriation cost shock
- 4.3.2 Shortage of cloud-native security talent
- 4.3.3 Emerging nation data-localisation mandates
- 4.3.4 Escalating e-waste from short server refresh cycles
- 4.4 Value Chain Analysis
- 4.5 Regulatory Landscape
- 4.6 Technological Outlook
- 4.7 Porter's Five Forces Analysis
- 4.7.1 Bargaining Power of Suppliers
- 4.7.2 Bargaining Power of Buyers
- 4.7.3 Threat of New Entrants
- 4.7.4 Threat of Substitutes
- 4.7.5 Intensity of Competitive Rivalry
- 4.8 Assessment of Macroeconomic Trends
5 MARKET SIZE AND GROWTH FORECASTS (VALUE)
- 5.1 By Component
- 5.1.1 Platforms
- 5.1.2 Services
- 5.2 By Deployment Model
- 5.2.1 Public Cloud
- 5.2.2 Private Cloud
- 5.2.3 Hybrid / Multi-Cloud
- 5.3 By Enterprise Size
- 5.3.1 Large Enterprises
- 5.3.2 Small and Medium-sized Enterprises (SMEs)
- 5.4 By End-user Industry
- 5.4.1 Banking, Financial Services and Insurance (BFSI)
- 5.4.2 Information Technology and Telecommunications
- 5.4.3 Manufacturing
- 5.4.4 Retail and E-Commerce
- 5.4.5 Healthcare and Life Sciences
- 5.4.6 Other Industries (Media, Government, Education, etc.)
- 5.5 By Geography
- 5.5.1 North America
- 5.5.1.1 United States
- 5.5.1.2 Canada
- 5.5.1.3 Mexico
- 5.5.2 South America
- 5.5.2.1 Brazil
- 5.5.2.2 Argentina
- 5.5.2.3 Rest of South America
- 5.5.3 Europe
- 5.5.3.1 United Kingdom
- 5.5.3.2 Germany
- 5.5.3.3 France
- 5.5.3.4 Italy
- 5.5.3.5 Spain
- 5.5.3.6 Russia
- 5.5.3.7 Rest of Europe
- 5.5.4 Asia-Pacific
- 5.5.4.1 China
- 5.5.4.2 Japan
- 5.5.4.3 India
- 5.5.4.4 South Korea
- 5.5.4.5 Australia and New Zealand
- 5.5.4.6 Southeast Asia
- 5.5.4.7 Rest of Asia-Pacific
- 5.5.5 Middle East and Africa
- 5.5.5.1 Middle East
- 5.5.5.1.1 Saudi Arabia
- 5.5.5.1.2 UAE
- 5.5.5.1.3 Turkey
- 5.5.5.1.4 Rest of Middle East
- 5.5.5.2 Africa
- 5.5.5.2.1 South Africa
- 5.5.5.2.2 Nigeria
- 5.5.5.2.3 Egypt
- 5.5.5.2.4 Rest of Africa
- 5.5.5.1 Middle East
- 5.5.1 North America
6 COMPETITIVE LANDSCAPE
- 6.1 Market Concentration
- 6.2 Strategic Moves
- 6.3 Market Share Analysis
- 6.4 Company Profiles (includes Global level Overview, Market level overview, Core Segments, Financials as available, Strategic Information, Market Rank/Share, Products and Services, Recent Developments)
- 6.4.1 Amazon Web Services, Inc.
- 6.4.2 Microsoft Corporation
- 6.4.3 Google LLC
- 6.4.4 International Business Machines Corporation
- 6.4.5 Oracle Corporation
- 6.4.6 Alibaba Group Holding Limited (Alibaba Cloud)
- 6.4.7 Tencent Cloud Computing (Beijing) Co., Ltd.
- 6.4.8 Huawei Technologies Co., Ltd.
- 6.4.9 VMware, Inc.
- 6.4.10 Red Hat, Inc.
- 6.4.11 SAP SE
- 6.4.12 Salesforce, Inc.
- 6.4.13 Broadcom Inc.
- 6.4.14 Cloudflare, Inc.
- 6.4.15 DigitalOcean Holdings, Inc.
- 6.4.16 Snowflake Inc.
- 6.4.17 CoreWeave, Inc.
- 6.4.18 Infosys Limited
- 6.4.19 Tata Consultancy Services Limited
- 6.4.20 Capgemini SE
7 MARKET OPPORTUNITIES AND FUTURE OUTLOOK
- 7.1 White-space and Unmet-need Assessment

