
PUBLISHER: Mordor Intelligence | PRODUCT CODE: 2035031

PUBLISHER: Mordor Intelligence | PRODUCT CODE: 2035031
Wild Pollock - Market Share Analysis, Industry Trends & Statistics, Growth Forecasts (2026 - 2031)
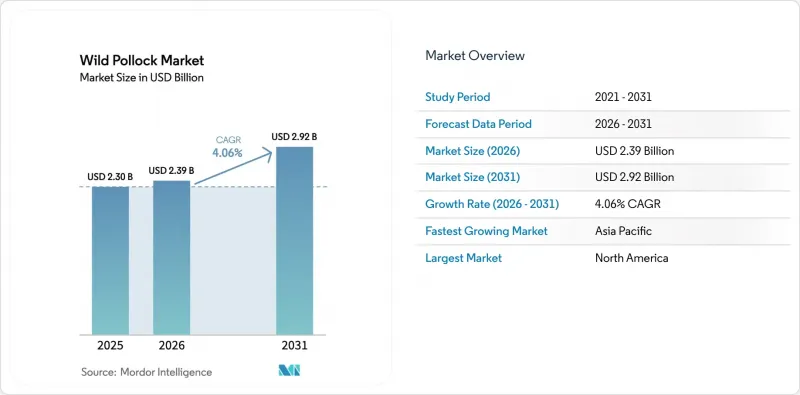
The Wild Pollock market size is expected to grow from USD 2.30 billion in 2025 to USD 2.39 billion in 2026 and is forecast to reach USD 2.92 billion by 2031 at 4.06% CAGR over 2026-2031.
This trajectory is anchored in the species' status as the backbone of the world's largest single-species fishery and its deep penetration into global fast-food supply chains. Intensifying competition between Russian and United States (U.S.) fleets, combined with quick-service restaurant (QSR) expansion, is reshaping cost structures and trade flows. Climate-driven stock shifts, particularly the northward migration of Pollock in the Bering Sea, add further complexity to quota management and supply security. Simultaneously, the decline in other whitefish stocks and ongoing consumer focus on lean protein are boosting substitution demand for Pollock in retail and food service channels.
Global Wild Pollock Market Trends and Insights
Expansion of global fast-food and QSR chains
The rapid expansion of global fast-food and quick-service restaurant (QSR) chains is significantly fueling demand in the wild pollock market as brands seek affordable, versatile, and sustainable whitefish options to meet rising consumer demand. McDonald's, which sources 100% wild-caught Alaska pollock for its Filet-O-Fish, plans to operate 50,000 locations by 2027 after opening 2,100 outlets in 2024. The chain's standardized seafood specification channels steady demand into the wild pollock market while incentivizing traceability and MSC labeling. Franchise roll-outs across Asia and South America amplify raw-material pull during a period when Russian supply is climbing and U.S. output is tightening. Although QSR menus are price sensitive, brand commitments to certified supply create resilience for incumbents that can verify provenance. Consequently, the global footprint of QSRs is a pivotal growth lever for the wild pollock market despite cyclic menu revisions.
Growing Demand for Affordable Lean Protein
Health-driven consumers are pivoting toward lower-mercury, high-protein seafood, pushing pollock consumption higher as cod and haddock supplies wane. The record U.S. household intake in 2024 coincided with heightened inflation, underscoring Pollock's value positioning. USDA reinforced this value narrative with a USD 50 million purchase for food assistance programs in 2025. Versatility from fish sticks to surimi enables processors to serve mainstream retail, institutional buyers, and industrial users without incurring premium raw-material costs. These attributes collectively enlarge the wild pollock market's accessible demand pool.
Declining Biomass in Atlantic Stocks
Accelerated depletion of cod and haddock has triggered quota tightening across the North Atlantic and ratcheted up scrutiny for all capture fisheries. Substitution of Pollock is temporarily positive for the wild pollock market, yet it reinforces conservation debates that could lead regulators to pre-emptively trim Pacific quotas if biomass signals weaken. Media coverage of overfishing elevates reputational risk for retailers stocking uncertified products, driving them toward aquaculture or plant-based analogs. Consequently, while Atlantic shortfalls lift demand in the near term, they also sharpen sustainability expectations that can constrain long-run catch allowances for Pollock.
Other drivers and restraints analyzed in the detailed report include:
- Supportive Quotas and MSC Certifications
- Rising Bering Sea and Russian Far-East Catch Volumes
- Ocean Warming Altering Migratory Patterns
For complete list of drivers and restraints, kindly check the Table Of Contents.
Segment Analysis
The Wild Pollock Market Report is Segmented by Geography (North America, Europe, Asia-Pacific, South America, Middle East, and Africa). The Report Includes Production Analysis (Volume), Consumption Analysis (Value and Volume), Export Analysis (Value and Volume), Import Analysis (Value and Volume), and Price Trend Analysis. The Market Forecasts are Provided in Terms of Value (USD) and Volume (Metric Tons).
Geography Analysis
North America's 38.61% wild pollock market share in 2025 reflects the structural heft of Alaska's 1.4 million metric tons annual harvest, integrated freezer-trawler fleets, and entrenched contracts with multinational QSR clients. Yet the region's USD 1.8 billion revenue decline in 2023 and 39% export fall-off to China highlight sensitivity to foreign tariff swings and geopolitical headwinds. Government interventions, including a USD 50 million USDA purchase, have provided short-term relief while processors accelerate cost-cutting and fleet modernization. Canadian and Mexican participation, though smaller, introduces diversification by way of secondary processing and cross-border logistics into the continental wild pollock market.
Asia-Pacific's forecast of 4.18% CAGR cements its role as the chief demand accelerator for the wild pollock market. China's 4.6 million metric tons seafood import appetite and January 2025 tariff hike on U.S. pollock to 5% expose U.S. fleets to margin erosion while inflating Russian-origin competitiveness. Japan and South Korea import steady volumes for surimi and frozen block reprocessing, sustaining liquidity even when mainland Chinese demand softens. Meanwhile, Vietnam's rise as a re-export hub underscores how intra-Asian trade arbitrage is reshaping flows and pricing tiers inside the wild pollock market.
Europe maintains strong import volumes supported by autonomous tariff quotas and high per-capita seafood consumption, yet Brexit logistics and Russia-related sanctions complicate transactional friction. The EU's carbon-pricing trajectory weighs heavily on distant-water trawl economics, nudging fleets toward hybrid vessels for pollock runs. Punitive UK tariffs on Russian seafood reroute supply chains toward Norway and Alaska, cushioning price falls for certified North American products. Emerging lanes into North Africa and the Gulf Cooperation Council countries provide incremental growth potential as disposable income rises and protein diversification accelerates within the broader wild pollock market.
- Market Overview
- Market Drivers
- Market Restraints
- Value/Supply-Chain Analysis
- Regulatory Landscape
- Technological Outlook
- PESTLE Analysis
- List of Stakeholders
Additional Benefits:
- The market estimate (ME) sheet in Excel format
- 3 months of analyst support
TABLE OF CONTENTS
1 Introduction
- 1.1 Study Assumptions and Market Definition
- 1.2 Scope of the Study
2 Research Methodology
3 Executive Summary
4 Market Landscape
- 4.1 Market Overview
- 4.2 Market Drivers
- 4.2.1 Expansion of global fast-food and QSR chains
- 4.2.2 Growing demand for affordable lean protein
- 4.2.3 Supportive quotas and MSC certifications
- 4.2.4 Rising Bering Sea and Russian Far-East catch volumes
- 4.2.5 Blockchain-based catch provenance premiums
- 4.2.6 Hybrid-electric trawlers lowering operating costs
- 4.3 Market Restraints
- 4.3.1 Declining biomass in Atlantic stocks
- 4.3.2 Ocean warming altering migratory patterns
- 4.3.3 Plant-based seafood analogues gaining share
- 4.3.4 Carbon taxation on distant-water fleets
- 4.4 Value/Supply-Chain Analysis
- 4.5 Regulatory Landscape
- 4.6 Technological Outlook
- 4.7 PESTLE Analysis
5 Market Size and Growth Forecasts (Production Analysis (Volume), Consumption Analysis (Volume and Value), Import Analysis (Volume and Value), Export Analysis (Volume and Value), and Price Trend Analysis)
- 5.1 By Geography
- 5.1.1 North America
- 5.1.1.1 United States
- 5.1.1.2 Canada
- 5.1.1.3 Mexico
- 5.1.2 South America
- 5.1.2.1 Brazil
- 5.1.2.2 Argentina
- 5.1.3 Europe
- 5.1.3.1 Germany
- 5.1.3.2 United Kingdom
- 5.1.3.3 France
- 5.1.3.4 Russia
- 5.1.3.5 Poland
- 5.1.3.6 Denmark
- 5.1.3.7 Netherlands
- 5.1.4 Asia-Pacific
- 5.1.4.1 China
- 5.1.4.2 Japan
- 5.1.4.3 South Korea
- 5.1.4.4 Vietnam
- 5.1.5 Middle East
- 5.1.5.1 Saudi Arabia
- 5.1.5.2 United Arab Emirates
- 5.1.6 Africa
- 5.1.6.1 South Africa
- 5.1.6.2 Nigeria
- 5.1.1 North America
6 Competitive Landscape
- 6.1 List of Stakeholders
- 6.1.1 Russian Fishery Company (RFC)
- 6.1.2 Trident Seafoods
- 6.1.3 Peter Pan Seafoods
- 6.1.4 North Pacific Seafoods
- 6.1.5 Maruha Nichiro
- 6.1.6 Van der Lee Seafish BV
7 Market Opportunities and Future Outlook

