
PUBLISHER: Mordor Intelligence | PRODUCT CODE: 2035092

PUBLISHER: Mordor Intelligence | PRODUCT CODE: 2035092
Data Center Immersion Cooling - Market Share Analysis, Industry Trends & Statistics, Growth Forecasts (2026 - 2031)
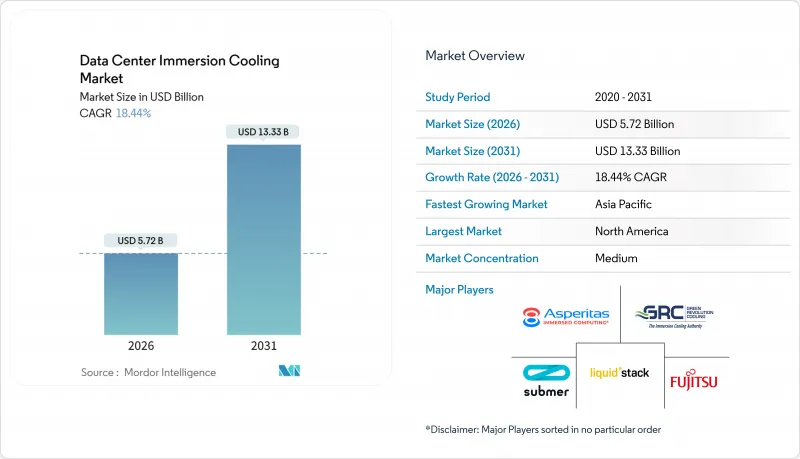
The Data Center Immersion Cooling Market size is estimated at USD 5.72 billion in 2026, and is expected to reach USD 13.33 billion by 2031, at a CAGR of 18.44% during the forecast period (2026-2031).
Soaring rack power densities above 100 kilowatts, a rapid pivot to graphics accelerators, and tightening sustainability mandates have moved liquid thermal management from proof of concept to mainstream choice. Hyperscalers now deploy immersion systems to avoid the escalating fan energy of air cooling, while edge operators rely on liquid baths to fit inference-optimized hardware into small footprints. Mineral oil still dominates fluid demand because of cost, but bio-based and synthetic hydrocarbon alternatives are gaining traction under European PFAS restrictions. Capital costs remain two to three times higher than raised-floor air architectures, yet operators view the energy and waste-heat monetization upside as sufficient to clear investment hurdles.
Global Data Center Immersion Cooling Market Trends and Insights
Proliferation of Hyperscale Data Centers
Operators are consolidating compute into gigawatt-class campuses that can negotiate renewable power at scale and amortize large capital projects. Meta ran 21 such sites in 2025 averaging more than 100 megawatts each, and its filings credit immersion cooling for raising server density per floor tile. Microsoft lifted liquid penetration to 15% of its fleet during 2025 and targets 40% by 2028, citing a route to sub-1.15 power usage effectiveness in temperate zones. Google began retrofitting eight legacy halls to house Tensor Processing Unit clusters that top 350 watts per chip. With each build exceeding USD 500 million, shifting to immersion lowers land, mechanical, and fan energy per compute unit.
Rising Rack Power Densities From AI and ML Workloads
Large language model training now fills racks that draw 80-120 kilowatts. NVIDIA's H100 hits 700 watts per device, so eight dual-GPU servers inside a 42U cabinet breach 100 kilowatts. Intel's Gaudi 3 accelerator checks in at 600 watts, and customer clusters above 1,000 chips specify immersion to avoid expanding chilled-water loops. AMD's MI300X peaks at 750 watts, with total cost of ownership modeling showing 20%-30% savings over five years once rack densities cross 60 kilowatts. Air's low heat capacity cannot cost-effectively move that load, whereas liquid's 25-times-higher thermal conductivity preserves performance margins and delays building expansions.
High Upfront CAPEX and Facility-Redesign Costs
Immersion tanks, manifold plumbing, and structural reinforcements push turnkey expense for a 1 megawatt block to USD 2.5-3.5 million, roughly double air cooling levels. Retrofit projects add 15%-25% due to floor strengthening, Class K suppression upgrades, and staff retraining. Payback stretches four to six years unless local power prices exceed USD 0.10 per kilowatt-hour or heat-offtake deals materialize. Colocation operators running thin margins hesitate, while smaller enterprises lack balance-sheet capacity, slowing broad uptake.
Other drivers and restraints analyzed in the detailed report include:
- Superior Energy-Efficiency and PUE Gains Over Air Cooling
- Regulatory Push Toward PFAS-Free Bio-Based Coolants
- Fragmented Standards and Vendor Interoperability Gaps
For complete list of drivers and restraints, kindly check the Table Of Contents.
Segment Analysis
Two-phase architectures will outgrow the wider data center immersion cooling market at 19.42% CAGR between 2026 and 2031. In 2025 single-phase systems still commanded a 62.43% data center immersion cooling market share thanks to compatibility with commodity servers and minimal fluid volatility. LiquidStack documented a European AI lab that removed pumps altogether by exploiting latent heat, cutting auxiliary loads 40%. Single-phase remains preferred for cryptocurrency and general HPC workloads, yet operators chasing 100 kilowatt racks view two-phase as the only route to passive rejection at scale.
Pumpless operation lowers total energy draw, and gravity-fed condensate return simplifies maintenance. However, reliance on hydrofluoroether fluids keeps costs high and exposes buyers to PFAS restrictions. Manufacturers are racing to qualify synthetic hydrocarbon and low-GWP chemistries, suggesting the two-phase premium will narrow over the forecast horizon. Interoperability efforts may also make mixed-phase deployments practical inside a single hall, giving operators a menu of thermal tools.
Mineral oil supplied 48.65% of liters in 2025 because of USD 3-5 per liter pricing and mature supply chains. Yet bio-based options are set for a 19.56% CAGR as operators in Europe and North America look to decarbonize. Cargill's ester delivers 0.17 W-m-K conductivity, 85% of oil levels, but satisfies ISO 14001 and Scope 3 accounting. Fluorocarbon fluids still enable two-phase cycles and held 22% share, though 3M's exit and Chemours' reformulation underscore supply and compliance risk.
Shell's synthetic hydrocarbon variant blended 0.16 W-m-K performance with a 265 °C flash point, removing the need for extensive fire suppression. De-ionized water, while not a full-immersion medium, earned 8% share inside direct-to-chip loops at hyperscalers. Going forward, fluid choice will hinge on local regulation, waste-heat goals, and insurer preferences, with operators likely to diversify chemistry portfolios to hedge risk.
The Data Center Immersion Cooling Market Report is Segmented by Type (Single-Phase Immersion Cooling System, and Two-Phase Immersion Cooling System), Cooling Fluid (Mineral Oil, and More), Application (HPC and More), Tier Type (Tier 1 and 2, and More), Data Center Size (Small Data Center, and More), Data Center Type (Colocation Data Center, and More), and Geography. Market Forecasts are Provided in Terms of Value (USD).
Geography Analysis
North America retained a 40.32% share in 2025 on the strength of hyperscale spend in Virginia, Oregon, and Texas. Microsoft earmarked USD 10 billion for U.S. liquid builds through 2028, citing temperate climates that allow direct air economization on the dry side. Meta's Prineville campus operated 15 000 submerged servers and posted a 1.06 annual power usage effectiveness, among the best globally. Canada gathered 8% of regional megawatts thanks to hydroelectric power in Quebec and British Columbia, while Mexico captured 4% serving nearshore manufacturing nodes.
Asia-Pacific is projected to grow at a 19.94% CAGR to 2031, led by China's sovereign AI push and India's incentive scheme worth USD 2 billion. Alibaba and Tencent already run immersion halls in Hangzhou and Shenzhen, each claiming cooling energy cuts above 30%. Japan contributed 18% of regional revenue in 2025, supported by subsidies under the Green Transformation program. South Korea, Australia, and New Zealand share the remainder, each targeting low-latency service for local consumption.
Europe controlled 28% of the global tally in 2025, propelled by efficiency mandates and heat-recovery incentives. Germany's EUR 500 million grant package for district heating tapped operators in Frankfurt and Munich, while the Netherlands leveraged renewable grids near Amsterdam. The United Kingdom added liquid rooms in London Docklands and Manchester to meet a 1.3 power usage effectiveness threshold. Middle East builds, though only 6% of world capacity, highlight immersion's thermal edge in 45 °C deserts, exemplified by a 150 megawatt Abu Dhabi project set to complete in late 2026. South America sits at 3%, dominated by Brazil's finance sector, and Africa at 2%, held back by grid stability.
- Fujitsu Limited
- Green Revolution Cooling (GRC) Inc.
- Submer Technologies SL
- LiquidStack Inc.
- Asperitas
- LiquidCool Solutions
- Midas Green Technologies
- Iceotope Technologies Ltd.
- Wiwynn Corporation
- DCX Ltd.
- Dell Technologies
- Intel Corporation
- Schneider Electric SE
- Vertiv Holdings Co.
- NVIDIA Corporation
- Asetek A/S
- Shell plc (Immersion Cooling Fluids)
- Cargill Inc. (NatureCool)
- 3M Company
- Chemours Company
- Molex LLC
- Hypertec Group
- Alibaba Cloud
- Tencent Cloud
Additional Benefits:
- The market estimate (ME) sheet in Excel format
- 3 months of analyst support
TABLE OF CONTENTS
1 INTRODUCTION
- 1.1 Study Assumptions and Market Definition
- 1.2 Scope of the Study
2 RESEARCH METHODOLOGY
3 EXECUTIVE SUMMARY
4 MARKET LANDSCAPE
- 4.1 Market Overview
- 4.2 Market Drivers
- 4.2.1 Proliferation of Hyperscale Data Centers
- 4.2.2 Rising Rack-Power Densities from AI and ML Workloads
- 4.2.3 Superior Energy-Efficiency and PUE Gains over Air Cooling
- 4.2.4 Regulatory Push toward PFAS-Free, Bio-Based Coolants
- 4.2.5 Monetization of Waste-Heat for District Heating Networks
- 4.2.6 AI-Assisted Discovery of Next-Generation Dielectric Fluids
- 4.3 Market Restraints
- 4.3.1 High Upfront CAPEX and Facility-Redesign Costs
- 4.3.2 Fragmented Standards and Vendor Interoperability Gaps
- 4.3.3 Supply-Chain Risk for Fluorinated Dielectrics
- 4.3.4 Limited Field Data on Long-Term Fluid-Hardware Compatibility
- 4.4 Industry Supply-Chain Analysis
- 4.5 Regulatory Landscape
- 4.6 Technological Outlook
- 4.6.1 Evolution of Data-Center Cooling
- 4.6.2 Energy-Consumption and Compute-Density Metrics
- 4.6.3 Teardown of Fluids, Processors, GPUs, Racks and Infrastructure
- 4.7 Porter's Five Forces Analysis
- 4.7.1 Bargaining Power of Suppliers
- 4.7.2 Bargaining Power of Buyers
- 4.7.3 Threat of New Entrants
- 4.7.4 Degree of Competition
- 4.7.5 Threat of Substitutes
- 4.8 Assesment of Macroeconomic Factors on the Market
5 MARKET SIZE AND GROWTH FORECASTS (VALUE)
- 5.1 By Type
- 5.1.1 Single-Phase Immersion Cooling System
- 5.1.2 Two-Phase Immersion Cooling System
- 5.2 By Cooling Fluid
- 5.2.1 Mineral Oil
- 5.2.2 De-Ionized Water
- 5.2.3 Fluorocarbon-Based Fluids
- 5.2.4 Synthetic Hydrocarbon Fluids
- 5.2.5 Bio-Based Fluids
- 5.3 By Application
- 5.3.1 High-Performance Computing (HPC)
- 5.3.2 Edge Computing
- 5.3.3 Artificial Intelligence and Machine Learning
- 5.3.4 Cloud and Hyperscale Applications
- 5.3.5 Cryptocurrency Mining
- 5.3.6 Other Applications
- 5.4 By Tier Type
- 5.4.1 Tier 1 and 2
- 5.4.2 Tier 3
- 5.4.3 Tier 4
- 5.5 By Data Center Size
- 5.5.1 Small Data Center
- 5.5.2 Medium Data Center
- 5.5.3 Large Data Center
- 5.5.4 Hyperscale Data Center
- 5.6 By Data Center Type
- 5.6.1 Colocation Data Center
- 5.6.2 Hyperscalers Data Center/CSPs
- 5.6.3 Enterprise and Edge Data Center
- 5.7 By Geography
- 5.7.1 North America
- 5.7.1.1 United States
- 5.7.1.2 Canada
- 5.7.1.3 Mexico
- 5.7.2 South America
- 5.7.2.1 Brazil
- 5.7.2.2 Argentina
- 5.7.2.3 Rest of South America
- 5.7.3 Europe
- 5.7.3.1 Germany
- 5.7.3.2 United Kingdom
- 5.7.3.3 France
- 5.7.3.4 Netherlands
- 5.7.3.5 Rest of Europe
- 5.7.4 Asia-Pacific
- 5.7.4.1 China
- 5.7.4.2 Japan
- 5.7.4.3 India
- 5.7.4.4 South Korea
- 5.7.4.5 Australia and New Zealand
- 5.7.4.6 Rest of Asia-Pacific
- 5.7.5 Middle East and Africa
- 5.7.5.1 Middle East
- 5.7.5.1.1 United Arab Emirates
- 5.7.5.1.2 Saudi Arabia
- 5.7.5.1.3 Turkey
- 5.7.5.1.4 Rest of Middle East
- 5.7.5.2 Africa
- 5.7.5.2.1 South Africa
- 5.7.5.2.2 Egypt
- 5.7.5.2.3 Nigeria
- 5.7.5.2.4 Rest of Africa
- 5.7.5.1 Middle East
- 5.7.1 North America
6 COMPETITIVE LANDSCAPE
- 6.1 Market Concentration
- 6.2 Strategic Moves
- 6.3 Market Share Analysis
- 6.4 Company Profiles (includes Global Level Overview, Market Level Overview, Core Segments, Financials as available, Strategic Information, Market Rank/Share, Products and Services, Recent Developments)
- 6.4.1 Fujitsu Limited
- 6.4.2 Green Revolution Cooling (GRC) Inc.
- 6.4.3 Submer Technologies SL
- 6.4.4 LiquidStack Inc.
- 6.4.5 Asperitas
- 6.4.6 LiquidCool Solutions
- 6.4.7 Midas Green Technologies
- 6.4.8 Iceotope Technologies Ltd.
- 6.4.9 Wiwynn Corporation
- 6.4.10 DCX Ltd.
- 6.4.11 Dell Technologies
- 6.4.12 Intel Corporation
- 6.4.13 Schneider Electric SE
- 6.4.14 Vertiv Holdings Co.
- 6.4.15 NVIDIA Corporation
- 6.4.16 Asetek A/S
- 6.4.17 Shell plc (Immersion Cooling Fluids)
- 6.4.18 Cargill Inc. (NatureCool)
- 6.4.19 3M Company
- 6.4.20 Chemours Company
- 6.4.21 Molex LLC
- 6.4.22 Hypertec Group
- 6.4.23 Alibaba Cloud
- 6.4.24 Tencent Cloud
7 MARKET OPPORTUNITIES AND FUTURE OUTLOOK
- 7.1 White-Space and Unmet-Need Assessment

