
PUBLISHER: Mordor Intelligence | PRODUCT CODE: 2035112

PUBLISHER: Mordor Intelligence | PRODUCT CODE: 2035112
United States Data Center - Market Share Analysis, Industry Trends & Statistics, Growth Forecasts (2026 - 2031)
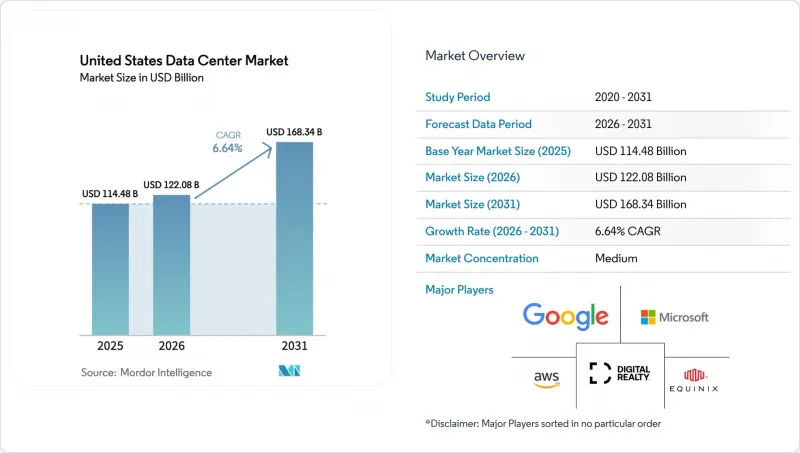
United States Data Center Market size in 2026 is estimated at USD 122.08 billion, growing from 2025 value of USD 114.48 billion with 2031 projections showing USD 168.34 billion, growing at 6.64% CAGR over 2026-2031.
In terms of installed base, the market is expected to grow from 57.08 thousand megawatt in 2025 to 109.56 thousand megawatt by 2030, at a CAGR of 13.93% during the forecast period (2025-2030). The market segment shares and estimates are calculated and reported in terms of MW. This expansion reflects unprecedented transformation driven by hyperscale operator demand and artificial intelligence infrastructure requirements, with record-breaking investment commitments exceeding USD 200 billion from major cloud providers. The market exhibits a stark regional concentration, with Atlanta holding the largest hotspot share at 21.68% in 2024, followed by Austin's emergence as the fastest-growing region, with a 5.21% CAGR through 2030. Power availability has emerged as the primary expansion constraint, with utilities reporting 5-7 year lead times for new capacity additions and transmission upgrades, creating development bottlenecks in core markets. Grid congestion and transmission limitations are reshaping site selection strategies, with secondary markets gaining traction as hyperscalers seek power-abundant locations beyond traditional hubs.
United States Data Center Market Trends and Insights
Growing Hyperscale Investments by Cloud Service Providers
Hyperscale operators have committed unprecedented capital to United States infrastructure expansion, with Meta allocating USD 65 billion, Microsoft USD 80 billion, and Amazon USD 30 billion for 2025 data center investments. OpenAI's Stargate initiative represents the largest single commitment at USD 500 billion over four years, targeting AI optimized facilities across Texas, Louisiana, and Indiana. These investments are driving fundamental shifts in facility design, with new builds targeting 50-100 MW power capacities compared to traditional 10-20 MW deployments. The scale of commitment reflects hyperscalers' recognition that AI workloads require dedicated infrastructure rather than shared colocation environments, fundamentally altering demand patterns and site selection criteria.
Rising Demand for AI and ML Ready GPU Clusters
Artificial intelligence infrastructure requirements are reshaping data center specifications, with GPU clusters demanding 80-130 kW per rack compared to traditional 6-8 kW densities. NVIDIA's H100 systems require approximately 41 kW per rack, while next generation Blackwell GB200 configurations reach 130 kW per rack, necessitating liquid cooling architectures and upgraded power distribution systems. CoreWeave's USD 9 billion acquisition of GPU optimized facilities demonstrates the premium valuations for AI ready infrastructure. The transition from air cooled to liquid cooled environments requires fundamental architectural changes, with direct to chip cooling becoming standard for high density deployments and immersion cooling gaining adoption for extreme power densities exceeding 100 kW per rack.
Grid Congestion and Sub 1 GW Power Availability in Hot Markets
Power transmission constraints have emerged as the primary growth limitation across major United States markets, with Northern Virginia requiring 5-7 year lead times for new utility capacity from Dominion Energy. The North American Electric Reliability Corporation reports that existing transmission infrastructure cannot support projected data center load growth without significant upgrades, creating bottlenecks in core markets where demand exceeds 1 GW annually. Silicon Valley faces particularly acute constraints, with some acquired sites lacking utility power access for over 10 years, forcing operators to consider fuel cells and on site generation alternatives. Grid congestion is driving geographic dispersion to secondary markets with available transmission capacity, fundamentally altering traditional site selection preferences and creating opportunities in previously overlooked regions with robust electrical infrastructure.
Other drivers and restraints analyzed in the detailed report include:
- Corporate Sustainability Commitments Driving Green Colocation Uptake
- Edge Deployments to Support 5G and IoT Latency Requirements
- Extended Lead Times for High Capacity Transformers and Switchgear
For complete list of drivers and restraints, kindly check the Table Of Contents.
Segment Analysis
Medium-sized data centers commanded 47.62% market share in 2025, reflecting enterprise preferences for balanced cost-performance infrastructure that supports diverse workload requirements without hyperscale complexity. Large facilities represent the fastest growing segment at 6.78% CAGR (2026-2031), driven by AI infrastructure demands requiring consolidated high density deployments. The United States data center market size for large facilities is projected to expand significantly as organizations consolidate computing resources to optimize operational efficiency and support increasingly complex workloads. Mega scale facilities continue expanding to accommodate hyperscaler campus strategies, while massive deployments serve specialized applications including cryptocurrency mining and high performance computing clusters. Small data centers maintain relevance for edge computing and local processing requirements, particularly in secondary markets where latency sensitive applications drive distributed architecture adoption.
The shift toward larger facility footprints reflects fundamental changes in workload characteristics, with AI training requiring clustered GPU resources that benefit from proximity and high bandwidth interconnection. Historical CAGR comparison reveals accelerating demand for large facilities, growing from 3.2% (2019-2024) to projected 6.78% (2026-2031), indicating sustained momentum in hyperscale infrastructure requirements. The United States data center market is experiencing this transformation as organizations recognize the efficiency advantages of consolidated operations. Regulatory compliance frameworks including SOC 2 Type II and FedRAMP requirements increasingly favor larger facilities with comprehensive security and operational controls, supporting the trend toward consolidated rather than distributed infrastructure deployment strategies.
Tier 3 facilities maintained 68.12% market share in 2025, representing the optimal balance between uptime reliability and capital efficiency for enterprise workloads requiring 99.982% availability. Tier 4 infrastructure emerges as the fastest growing segment at 6.83% CAGR (2026-2031), driven by financial services and healthcare organizations demanding 99.995% uptime guarantees and fault tolerant architectures. The United States data center market share for Tier 4 facilities is increasing as mission critical applications require higher reliability standards and regulatory compliance mandates strengthen. Tier 1 and 2 facilities collectively serve cost sensitive applications and development environments where brief outages are acceptable, maintaining steady demand in secondary markets and edge deployments.
The acceleration in Tier 4 adoption reflects increasing enterprise recognition that downtime costs exceed infrastructure premiums for mission critical applications. Financial services regulations including Basel III and healthcare compliance requirements under HIPAA are driving demand for concurrent maintainable infrastructure with no single points of failure. The United States data center industry is responding with expanded Tier 4 capacity development across primary markets. Tier 4 facilities command premium pricing of 25-40% above Tier 3 equivalents, but deliver 99.6% fewer outage minutes annually, creating compelling value propositions for applications where availability directly impacts revenue generation and regulatory compliance.
The United States Data Center Market Report is Segmented by Data Center Size (Large, Massive, Medium, Mega, and Small), Tier Standard(Tier 1 and 2, Tier 3, and Tier 4), Data Center Type (Hyperscale/Self-Built, Enterprise/Edge, and Colocation), End User Industry ( IT and ITES, E-Commerce, Government, Manufacturing, Media and Entertainment, and More), and Hotspot. The Market Forecasts are Provided in Terms of IT Load Capacity (MW).
List of Companies Covered in this Report:
- Amazon Web Services, Inc
- Google Inc
- Microsoft Corporation
- Digital Realty Trust, Inc
- Cloudhq
- Cyrusone
- Digital Bridge (Formely Known As Switch)
- Stack Infrastructure
- Qts Realty Trust, Llc
- Quality Technology Services
- Equinix Inc
- Menlo Equities Llc
- Aligned Data Center
- Ibm Corporation
- Serverfarm
Additional Benefits:
- The market estimate (ME) sheet in Excel format
- 3 months of analyst support
TABLE OF CONTENTS
1 INTRODUCTION
- 1.1 Study Assumptions and Market Definition
- 1.2 Scope of the Study
2 RESEARCH METHODOLOGY
3 EXECUTIVE SUMMARY
4 MARKET LANDSCAPE
- 4.1 Market Overview
- 4.2 Market Drivers
- 4.2.1 Growing hyperscale investments by cloud service providers
- 4.2.2 Rising demand for AI- and ML-ready GPU clusters
- 4.2.3 Corporate sustainability commitments driving green colocation uptake
- 4.2.4 Edge deployments to support 5G and IoT latency requirements
- 4.2.5 Tax incentives in secondary and tertiary U.S. metros
- 4.2.6 Under-reported: Growth of sovereign cloud requirements for public agencies
- 4.3 Market Restraints
- 4.3.1 Grid congestion and sub-1 GW power availability in hot markets
- 4.3.2 Extended lead-times for high-capacity transformers and switchgear
- 4.3.3 Scope--2 carbon-matching mandates complicating procurement
- 4.3.4 Under-reported: Scarcity of qualified controls engineers for hyperscale campuses
- 4.4 Market Outlook
- 4.4.1 IT Load Capacity
- 4.4.2 Raised Floor Space
- 4.4.3 Colocation Revenue
- 4.4.4 Installed Racks
- 4.4.5 Rack Space Utilization
- 4.4.6 Submarine Cable
- 4.5 Key Industry Trends
- 4.5.1 Smartphone Users
- 4.5.2 Data Traffic Per Smartphone
- 4.5.3 Mobile Data Speed
- 4.5.4 Broadband Data Speed
- 4.5.5 Fiber Connectivity Network
- 4.5.6 Regulatory Framework
- 4.6 Value Chain and Distribution Channel Analysis
- 4.7 Regulatory Landscape
- 4.8 Technological Outlook
- 4.9 Porter's Five Forces Analysis
- 4.9.1 Threat of New Entrants
- 4.9.2 Bargaining Power of Suppliers
- 4.9.3 Bargaining Power of Buyers
- 4.9.4 Threat of Substitutes
- 4.9.5 Competitive Rivalry
5 MARKET SIZE AND GROWTH FORECASTS (MEGAWATT)
- 5.1 By Data Center Size
- 5.1.1 Large
- 5.1.2 Massive
- 5.1.3 Medium
- 5.1.4 Mega
- 5.1.5 Small
- 5.2 By Tier Standard
- 5.2.1 Tier 1 and 2
- 5.2.2 Tier 3
- 5.2.3 Tier 4
- 5.3 By Data Center Type
- 5.3.1 Hyperscale/Self-built
- 5.3.2 Enterprise/Edge
- 5.3.3 Colocation
- 5.3.3.1 Non-Utilized
- 5.3.3.2 Utilized
- 5.3.3.2.1 Retail Colocation
- 5.3.3.2.2 Wholesale Colocation
- 5.4 By End User Industry
- 5.4.1 BFSI
- 5.4.2 IT and ITES
- 5.4.3 E-Commerce
- 5.4.4 Government
- 5.4.5 Manufacturing
- 5.4.6 Media and Entertainment
- 5.4.7 Telecom
- 5.4.8 Other End Users
- 5.5 By Hotspot
- 5.5.1 Atlanta
- 5.5.2 Austin
- 5.5.3 Dallas
- 5.5.4 Rest of United States
6 COMPETITIVE LANDSCAPE
- 6.1 Market Concentration
- 6.2 Strategic Moves
- 6.3 Market Share Analysis
- 6.4 Company Profiles (includes Global level Overview, Market level overview, Core Segments, Financials as available, Strategic Information, Market Rank/Share for key companies, Products and Services, and Recent Developments)
- 6.4.1 Amazon Web Services, Inc
- 6.4.2 Google Inc
- 6.4.3 Microsoft Corporation
- 6.4.4 Digital Realty Trust, Inc
- 6.4.5 Cloudhq
- 6.4.6 Cyrusone
- 6.4.7 Digital Bridge (Formely Known As Switch)
- 6.4.8 Stack Infrastructure
- 6.4.9 Qts Realty Trust, Llc
- 6.4.10 Quality Technology Services
- 6.4.11 Equinix Inc
- 6.4.12 Menlo Equities Llc
- 6.4.13 Aligned Data Center
- 6.4.14 Ibm Corporation
- 6.4.15 Serverfarm
7 MARKET OPPORTUNITIES AND FUTURE OUTLOOK
- 7.1 White-space and Unmet-Need Assessment

