
PUBLISHER: Mordor Intelligence | PRODUCT CODE: 2035164

PUBLISHER: Mordor Intelligence | PRODUCT CODE: 2035164
Amusement Parks - Market Share Analysis, Industry Trends & Statistics, Growth Forecasts (2026 - 2031)
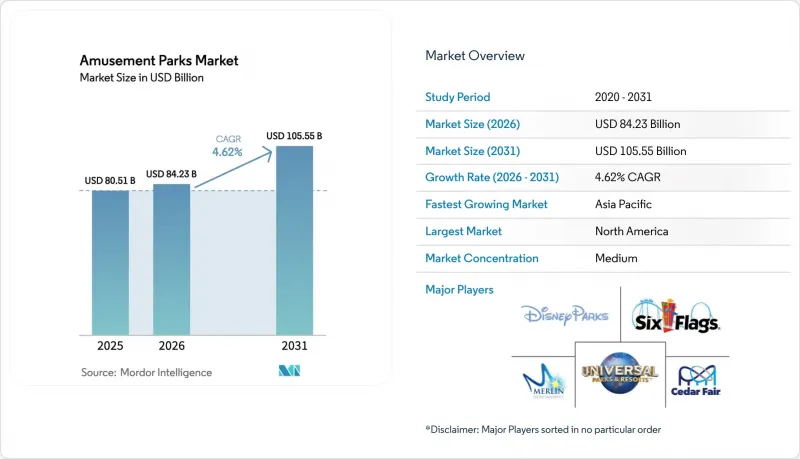
The Amusement Parks market size is expected to grow from USD 80.51 billion in 2025 to USD 84.23 billion in 2026 and is forecast to reach USD 105.55 billion by 2031 at 4.62% CAGR over 2026-2031.
Sustained demand for out-of-home leisure, rising middle-class disposable income in emerging economies, and strategic investments in immersive technologies underpin this expansion. Pent-up appetite for social experiences following pandemic restrictions continues to lift per-capita spend, while IP-based attractions and mixed-use resort formats extend average length of stay. Operators are accelerating hotel, dining, and branded merchandise initiatives to mitigate weather-related volatility and diversify cash flows. Technology adoption-particularly AI-powered dynamic pricing, queue management, and AR/VR ride systems-enhances capacity utilisation and guest satisfaction, positioning the amusement park market as a resilient pillar of the broader experience economy.
Global Amusement Parks Market Trends and Insights
IP-Driven Immersive Experiences Elevating Per-Capita Spend
Intellectual-property storytelling converts rides into living narratives that lengthen dwell time, lift merchandise sales, and justify premium pricing. Universal's USD 7 billion Epic Universe, launching in 2025, will bundle five distinct worlds to encourage multi-day visitation. Shanghai's planned Harry Potter redevelopment targets 2 million annual guests and USD 150 million in revenue, underscoring IP's revitalisation power. Operators leverage cross-platform franchises to monetise emotions across food, retail, and lodging, reinforcing competitive moats. As consumer attachment deepens, the amusement park market gains pricing latitude without sacrificing volume.
Dynamic Pricing & AI-Based Revenue Optimization
Borrowing from airlines, dynamic pricing tools use real-time demand signals to balance capacity and maximise yield. Disney and Universal report higher average ticket revenue despite controlled visitation, while European pioneer Tivoli Gardens combines AI guest segmentation with personalised offers to lift per-capita spend . Six Flags' alliance with Google, HCL Tech, and Dell enables cloud-scale analytics that trigger on-site recommendations and off-peak discounts. Sophisticated revenue management supports affordable entry tiers for budget visitors and premium bundles for affluent segments, broadening appeal while sustaining margins. These capabilities amplify the predictability of the amusement park market and support continued capital deployment.
High CAPEX & Rising OPEX for New Ride Technologies
Next-generation coasters and media-rich attractions now command individual budgets matching entire small-park builds. Wonderla's Chennai site invested Rs 515 crore (USD 62 million) for launch, with the flagship coaster alone costing Rs 70-80 crore (USD 8.4-9.6 million). In China, 40% of parks operate at a loss; Dayong Town attracted only 13 daily visitors after a USD 300 million outlay, illustrating the risk imbalance for under-capitalised developers. Labour shortages compound pressure, prompting Universal Studios Japan to recruit 200+ seniors to maintain service levels. Elevated expenditure funnels market power toward larger groups and slows greenfield expansion in the amusement park market.
Other drivers and restraints analyzed in the detailed report include:
- Mixed-Use Resort Integration Extending Visitor Length-of-Stay
- Post-Pandemic Experience-Economy Rebound
- Competition from At-Home Digital & VR Entertainment
For complete list of drivers and restraints, kindly check the Table Of Contents.
Segment Analysis
Theme parks held a 51.92% amusement park market share in 2025, reflecting their role as anchor destinations that attract international tourism and catalyse mixed-use developments. Water parks recorded the fastest 7.08% CAGR, propelled by indoor facilities that permit all-season operations and modular surf lagoons requiring lower capital. Adventure, edutainment, and wildlife concepts fill experiential niches, while surf parks extend beach culture into urban interiors. Market leaders increasingly co-locate multiple park types to broaden demographic appeal and elevate per-capita spend.
Technological retrofits such as variable-speed pumps, solar arrays, and grey-water recycling suppress utility costs and support sustainability mandates, enhancing margins across formats. North American saturation has pushed incumbents to bundle water-park hotels with conferences to unlock incremental demand, whereas emerging Asian markets pursue first-wave rollouts. Chimelong Ocean Kingdom's blend of marine exhibits, rides, and water attractions drew over 10 million visitors in 2024, exemplifying diversified clustering. Consequently, the amusement park market size for hybrid complexes is forecast to outpace single-type venues through 2031.
In 2025, roller coasters represented 31.05% of the amusement park market, highlighting their role as key revenue drivers and core attractions. AR/VR dark rides, with a robust CAGR of 10.21%, offer cost-effective solutions for updating experiences without extensive infrastructure investments. Water slides and river rapids benefit from the rising demand in the aquatic entertainment segment, driving growth opportunities. Flat rides continue to attract family-oriented visitors, ensuring steady throughput and operational efficiency. Free-fall towers remain a cost-effective option for mid-tier thrill attractions, enhancing the diversity of amusement park portfolios.
Manufacturers integrate magnetic launches, on-board audio, and haptic seats to modernise classic coaster experiences. Screen-based rides merge physical motion with dynamic media, illustrated by Universal's Transformers attraction, which can update content overnight. AI-powered motion platforms simulate variable narratives tailored to guest profiles, deepening personal engagement. These technology overlays help the amusement park market retain novelty while controlling construction expenditure.
The Amusement Parks Market is Segmented by Park Type (Theme, Water, and More), by Ride Type (Roller Coasters, Water Rides & Slides, and More), by Revenue Source (Tickets, Food & Beverages, and More), by Age Group (Children, Adults and More), by Ownership Model (Private-Corporate, Private-Family, and More), and by Geography (North America, South America, and More). The Market Forecasts are Provided in Terms of Value (USD).
Geography Analysis
North America retained 35.40% of global revenue in 2025, buoyed by concentrated IP portfolios and established travel corridors. Universal and Disney together have earmarked USD 67 billion for new Florida capacity and refurbishments, reaffirming their long-run commitment despite hurricane exposure. Canadian and Mexican properties absorb spill-over demand when currency gyrations widen purchasing-power gaps, creating cross-border arbitrage opportunities for consumers. Climate volatility, however, forces higher insurance deductibles and capital outlays for storm-hardening, compressing margins for smaller operators.
The Middle East is experiencing a robust 9.05% CAGR, driven by sovereign wealth fund investments that are expediting the development of large-scale leisure districts. Dubai leverages its position as a global transport hub to channel international layover traffic into short-stay park offerings. Abu Dhabi's introduction of branded attractions is fostering accelerated brand clustering in the region. However, the primary challenge lies in converting construction timelines into sustained international tourist inflows. Seasonal constraints, particularly the extreme summer heat, pose additional risks to maintaining consistent visitation levels.
The Asia Pacific region offers substantial untapped growth opportunities. The development of family-focused intellectual property, such as Peppa Pig and Harry Potter projects near Shanghai, reflects the increasing demand for such entertainment. In India, ventures like Wonderla Chennai highlight the expanding disposable income of the middle class. Effective market penetration requires a strong focus on localization, including adaptations in food, language, and holiday calendars. Operators achieving success in this region integrate global safety standards with culturally relevant narratives to enhance consumer engagement
- The Walt Disney Company
- Comcast (Universal Parks & Resorts)
- Merlin Entertainments
- Six Flags Entertainment Corporation
- Cedar Fair Entertainment Company
- United Parks & Resorts (SeaWorld)
- Parques Reunidos
- Chimelong Group
- Fantawild Holdings
- OCT Parks China (Happy Valley)
- Compagnie des Alpes
- Herschend Family Entertainment
- Dubai Parks & Resorts (DXB Entertainments)
- Village Roadshow Theme Parks
- Wonderla Holidays Ltd.
- Grupo Xcaret
- Efteling
- Great Wolf Resorts
- Hershey Entertainment & Resorts
- Genting (Resorts World Sentosa)
Additional Benefits:
- The market estimate (ME) sheet in Excel format
- 3 months of analyst support
TABLE OF CONTENTS
1 Introduction
- 1.1 Study Assumptions & Market Definition
- 1.2 Scope of the Study
2 Research Methodology
3 Executive Summary
4 Market Landscape
- 4.1 Market Overview
- 4.2 Market Drivers
- 4.2.1 IP-driven immersive experiences elevating per-capita spend
- 4.2.2 Dynamic pricing & AI-based revenue optimisation
- 4.2.3 Mixed-use resort integration extending visitor length-of-stay
- 4.2.4 Post-pandemic experience-economy rebound
- 4.2.5 Modular water & surf-park technology lowering CAPEX barriers
- 4.2.6 Data-driven personalisation boosting in-park spend
- 4.3 Market Restraints
- 4.3.1 High CAPEX & rising OPEX for new ride technologies
- 4.3.2 Competition from at-home digital & VR entertainment
- 4.3.3 Climate-change-driven weather volatility & insurance costs
- 4.3.4 Sustainability / animal-ethics scrutiny on themed zoos
- 4.4 Value / Supply-Chain Analysis
- 4.5 Regulatory Landscape
- 4.6 Technological Outlook
- 4.7 Porter's Five Forces
- 4.7.1 Threat of New Entrants
- 4.7.2 Bargaining Power of Buyers
- 4.7.3 Bargaining Power of Suppliers
- 4.7.4 Threat of Substitutes
- 4.7.5 Industry Rivalry
5 Market Size & Growth Forecasts (Value)
- 5.1 By Park Type
- 5.1.1 Theme Parks
- 5.1.2 Water Parks
- 5.1.3 Adventure / Thrill Parks
- 5.1.4 Edutainment & Zoo Parks
- 5.1.5 Surf & Wave Parks
- 5.2 By Ride Type
- 5.2.1 Roller Coasters
- 5.2.2 Water Rides & Slides
- 5.2.3 Flat & Spinning Rides
- 5.2.4 AR/VR & Immersive Dark Rides
- 5.2.5 Free-fall & Drop Towers
- 5.3 By Revenue Source
- 5.3.1 Admission / Ticketing
- 5.3.2 Food & Beverage
- 5.3.3 Merchandise & Licensing
- 5.3.4 Hotels, Resorts & Campgrounds
- 5.3.5 Events, Sponsorships & Ancillary
- 5.4 By Age Group
- 5.4.1 Children (0-19 years)
- 5.4.2 Adults (20-54 years)
- 5.4.3 Senior Citizens (55+ years)
- 5.5 By Ownership Model
- 5.5.1 Private-Corporate
- 5.5.2 Private-Family / Independent
- 5.5.3 Public / Government-backed
- 5.6 By Geography
- 5.6.1 North America
- 5.6.1.1 United States
- 5.6.1.2 Canada
- 5.6.1.3 Mexico
- 5.6.2 South America
- 5.6.2.1 Brazil
- 5.6.2.2 Peru
- 5.6.2.3 Chile
- 5.6.2.4 Argentina
- 5.6.2.5 Rest of South America
- 5.6.3 Europe
- 5.6.3.1 United Kingdom
- 5.6.3.2 Germany
- 5.6.3.3 France
- 5.6.3.4 Spain
- 5.6.3.5 Italy
- 5.6.3.6 BENELUX
- 5.6.3.7 NORDICS
- 5.6.3.8 Rest of Europe
- 5.6.4 Asia-Pacific
- 5.6.4.1 China
- 5.6.4.2 India
- 5.6.4.3 Japan
- 5.6.4.4 South Korea
- 5.6.4.5 Australia
- 5.6.4.6 South-East Asia
- 5.6.4.7 Rest of Asia-Pacific
- 5.6.5 Middle East and Africa
- 5.6.5.1 Middle East
- 5.6.5.1.1 United Arab Emirates
- 5.6.5.1.2 Saudi Arabia
- 5.6.5.1.3 South Africa
- 5.6.5.1.4 Nigeria
- 5.6.5.1.5 Rest of Middle East and Africa
- 5.6.5.1 Middle East
- 5.6.1 North America
6 Competitive Landscape
- 6.1 Market Concentration
- 6.2 Strategic Moves
- 6.3 Market Share Analysis
- 6.4 Company Profiles (includes Global level Overview, Market level overview, Core Segments, Financials as available, Strategic Information, Market Rank/Share for key companies, Products & Services, and Recent Developments)
- 6.4.1 The Walt Disney Company
- 6.4.2 Comcast (Universal Parks & Resorts)
- 6.4.3 Merlin Entertainments
- 6.4.4 Six Flags Entertainment Corporation
- 6.4.5 Cedar Fair Entertainment Company
- 6.4.6 United Parks & Resorts (SeaWorld)
- 6.4.7 Parques Reunidos
- 6.4.8 Chimelong Group
- 6.4.9 Fantawild Holdings
- 6.4.10 OCT Parks China (Happy Valley)
- 6.4.11 Compagnie des Alpes
- 6.4.12 Herschend Family Entertainment
- 6.4.13 Dubai Parks & Resorts (DXB Entertainments)
- 6.4.14 Village Roadshow Theme Parks
- 6.4.15 Wonderla Holidays Ltd.
- 6.4.16 Grupo Xcaret
- 6.4.17 Efteling
- 6.4.18 Great Wolf Resorts
- 6.4.19 Hershey Entertainment & Resorts
- 6.4.20 Genting (Resorts World Sentosa)
7 Market Opportunities & Future Outlook
- 7.1 White-space & Unmet-Need Assessment

