PUBLISHER: Mordor Intelligence | PRODUCT CODE: 2043828

PUBLISHER: Mordor Intelligence | PRODUCT CODE: 2043828
Rare Earth Elements - Market Share Analysis, Industry Trends & Statistics, Growth Forecasts (2026 - 2031)
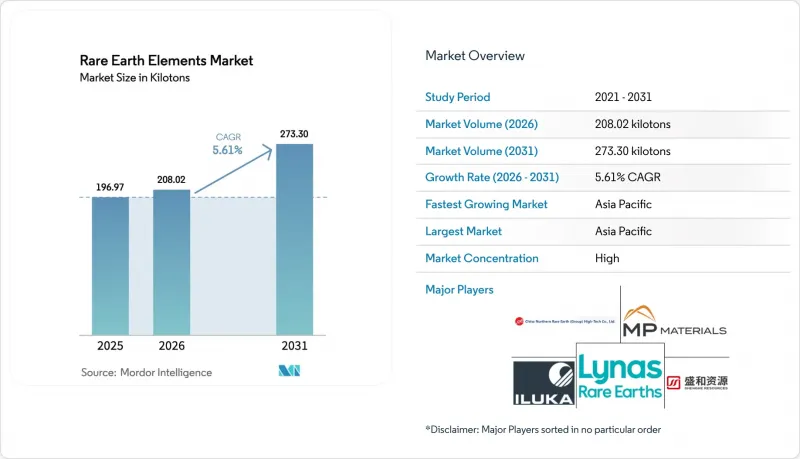
The Rare Earth Elements Market size is projected to be 196.97 kilotons in 2025, 208.02 kilotons in 2026, and reach 273.30 kilotons by 2031, growing at a CAGR of 5.61% from 2026 to 2031.
Structural demand tied to electric-vehicle traction motors, offshore wind turbines, and grid-scale clean-energy infrastructure underpins this expansion, while lingering processing bottlenecks and policy-induced supply shocks temper the growth trajectory. Ongoing industrial automation roll-outs, additive-manufacturing adoption in aerospace, and tightening global emission standards provide additional demand pull, even as substitution research for dysprosium and terbium remains technically constrained. On the supply side, heavy reliance on China for both mining and separation amplifies price volatility, prompting strategic stockpiling and multi-year offtake agreements that stabilize short-term volumes but inflate procurement costs. Intensifying vertical integration among Western producers, alongside government incentives in the United States, Australia, and the European Union, signals a shift toward regionalized midstream capacity that will progressively reshape the Rare Earth Elements market through 2031.
Global Rare Earth Elements Market Trends and Insights
Renewable-Energy Turbine Magnet Requirement
Neodymium-iron-boron magnets, favored by direct-drive wind turbines and battery-electric vehicles, offer unparalleled weight-to-power ratios compared to ferrite alternatives. Demand for magnet-grade rare earths is expected to grow significantly, predominantly driven by wind energy and mobility sectors. Each 3 MW offshore turbine incorporates neodymium-praseodymium and dysprosium, with global offshore installations experiencing substantial growth. The momentum in electric vehicles is undeniable, with shipments projected to increase significantly in the coming years. However, dysprosium supply poses a challenge, with a staggering majority sourced from China's ionic-clay deposits. Moreover, while efforts to find substitutes are ongoing, they've struggled to dip below a content threshold without jeopardizing thermal stability. This robust demand for magnets solidifies the position of the Rare Earth Elements market through 2031.
Dependency of Green Technology on Rare Earth Elements
Decarbonization policies are weaving rare earth elements into the fabric of the energy transition. From cerium oxide catalysts powering hydrogen fuel cells to yttrium phosphors illuminating solid-state lighting, these elements play a pivotal role. While the European Union's 'Fit for 55' initiative and the U.S. 'Inflation Reduction Act' champion domestic sourcing, they fall short in addressing the processing gap. Demand for lanthanum in nickel-metal-hydride batteries has eased. However, as emission norms tighten in emerging markets, demand for cerium oxide in automotive catalysts remains steady. This presents a strategic risk: the pace of clean-tech adoption might outstrip the growth of non-Chinese capacities, potentially leaving OEMs vulnerable to a concentrated supply chain.
Chinese Policy-Induced Price Volatility
In October 2025, Beijing expanded its export controls, introducing a content threshold. This new rule mandates that downstream producers certify the source of every rare earth atom in their finished goods. As a result, European importers witnessed a dramatic surge in dysprosium oxide prices, compelling turbine OEMs to scramble and renegotiate their supply contracts. While these controls faced a suspension until November 2026, the move set a precedent. It led to multi-year offtake deals being struck at premiums, underscoring the Rare Earth Elements market's heightened sensitivity to shifts in Chinese policy.
Other drivers and restraints analyzed in the detailed report include:
- Growing Demand from Battery Applications
- Scandium-Aluminum Alloys in Aerospace Manufacturing
- Inconsistent Supply of Rare Earth Elements
For complete list of drivers and restraints, kindly check the Table Of Contents.
Segment Analysis
Light rare earths captured 87.18% of volume in 2025 and are set to grow at a 5.92% CAGR through 2031. Cerium oxide, a key player in automotive catalysts, maintains a stable demand, bolstered by tightening Euro 7 and China VI standards. Lanthanum, essential for nickel-metal-hydride batteries, sees consistent consumption yearly. Meanwhile, neodymium-praseodymium production has exemplified the magnet-driven demand. Although heavy rare earths make up a smaller portion of the volume, they command premium prices. This is largely due to dysprosium, terbium, and yttrium's lack of scalable substitutes and their constrained supply. Dysprosium, the fastest-growing element, will track a 7.26% CAGR on the back of high-temperature magnet demand for EVs and offshore turbines.
China's dominance in supply heightens price sensitivity. Ionic-clay deposits in Jiangxi and Guangxi provinces produce a significant portion of the world's dysprosium, putting Western OEMs at risk of policy shocks. While Australian projects like Browns Range and Nolans offer a glimmer of diversification, they grapple with lengthy permitting and financing challenges. Consequently, producers capable of delivering separated heavy oxides retain significant pricing power, solidifying the premium structure in the Rare Earth Elements market.
Cerium commanded 38.16% of the elemental share in 2025, driven by catalytic-converter and glass-polishing uses, and will remain volume leader through 2031. Forecasts indicate cerium will maintain its leadership position through 2031. Neodymium and praseodymium, together accounting for a significant portion of the market, play pivotal roles in the production of permanent magnets across China, Japan, and the U.S. Lanthanum finds its primary applications in fluid-cracking catalysts and nickel-metal-hydride batteries. Dysprosium, despite constituting a smaller share of the market, enjoys a high unit value and a 7.26% CAGR. This underscores dysprosium's critical importance in formulating high-temperature magnets, especially for electric vehicle traction motors and wind turbines. Terbium and yttrium, while occupying smaller market niches-terbium in green phosphors and yttrium in ceramics and LEDs-both grapple with similar supply constraints.
Scandium, with limited annual production, commands the highest price per kilogram in the market, a testament to its rarity and challenges in byproduct recovery. However, should recovery circuits in Canada and the U.S. become operational, scandium's applications could broaden from cabin brackets to encompass larger aerospace structural components, potentially expanding its presence in the Rare Earth Elements market.
The Rare Earth Elements Market Report is Segmented by Product Type (Light and Heavy), Element (Cerium, Neodymium, Lanthanum, Dysprosium, Terbium, Yttrium, Scandium, and Other Elements), Application (Catalysts, Ceramics, and More), End-Use Industry (Clean Energy, Consumer Electronics, and More), and Geography (Asia-Pacific, North America, Europe, and More). Market Forecasts are Provided in Terms of Volume (Tons).
Geography Analysis
Asia-Pacific accounted for 86.29% of global volume in 2025 and will maintain dominance with a 5.97% CAGR to 2031. China produced oxides and commanded the majority of the separation capacity. This dominance allowed China to exert export-control leverage, causing European dysprosium prices to surge significantly post-October 2025. Australia is positioning itself as the leading non-Chinese supplier. Arafura's Nolans project aims to produce neodymium-praseodymium oxide by 2027. Concurrently, Iluka Resources is progressing with a refinery targeting mixed-carbonate output. To mitigate their reliance, Japan and South Korea have inked multi-year contracts with Lynas and MP Materials.
North America is making strides to localize its supply. Mountain Pass, having produced concentrate in 2024, halted exports to China in Q3 2025, redirecting its feed to a separation plant in California. A significant equity stake from the Department of Defense is backing a heavy-earth circuit, targeting output by mid-2026. Energy Fuels' White Mesa mill, traditionally focused on uranium, pivoted to process monazite. Meanwhile, Ucore is in the process of establishing a RapidSX plant in Alaska.
Despite its market presence in 2025, Europe remains heavily reliant on imports. This is in light of the Critical Raw Materials Act, which sets ambitious targets for extraction, processing, and recycling by 2030. While LKAB's Per Geijer deposit boasts significant oxide reserves, its development is a decade away. Pilot recycling initiatives from Cyclic Materials and Urban Mining Company seek to address the shortfall, yet the region lacks any commercial-scale separator. Both South America and the Middle East-Africa regions combined accounted for a minimal share of the total volume. However, Brazil and South Africa are eyeing potential capacities that could materialize post-2030.
- Appia REU
- Arafura Rare Earths
- China Rare Earth Group Resources Technology Co., Ltd.
- China Rare Earth Holdings Limited
- ChinaTungsten
- Energy Fuels Inc.
- Iluka Resources Limited
- Jiangxi Copper Corporation
- Lynas Rare Earths Ltd
- Mitsubishi Corporation RtM Japan Ltd.
- MP Materials
- Northern Minerals
- Northern Rare Earth
- Rio Tinto
- Shenghe Resources Holding Co., Ltd.
- Texas Mineral Resources Corp.
- Ucore Rare Metals Inc.
- Yuyan Rare Earth New Materials Co., Ltd.
Additional Benefits:
- The market estimate (ME) sheet in Excel format
- 3 months of analyst support
TABLE OF CONTENTS
1 Introduction
- 1.1 Study Assumptions and Market Definition
- 1.2 Scope of the Study
2 Research Methodology
3 Executive Summary
4 Market Landscape
- 4.1 Market Overview
- 4.2 Market Drivers
- 4.2.1 Renewable-Energy Turbine Magnet Requirement
- 4.2.2 Dependency of 'Green Technology' on Rare Earth Elements
- 4.2.3 Growing demand from battery applications
- 4.2.4 Scandium-Aluminum Alloys Adoption in Aerospace Manufacturing
- 4.2.5 High Demand in Consumer Electronics
- 4.3 Market Restraints
- 4.3.1 Chinese Policy-Induced Price Volatility
- 4.3.2 Price Volatility Linked to Chinese Policy Shifts
- 4.3.3 Inconsistent Supply of Rare Earth Elements
- 4.4 Value Chain Analysis
- 4.5 Porter's Five Forces
- 4.5.1 Bargaining Power of Suppliers
- 4.5.2 Bargaining Power of Consumers
- 4.5.3 Threat of New Entrants
- 4.5.4 Threat of Substitutes
- 4.5.5 Degree of Competition
- 4.6 Supply Analysis
- 4.7 Regulatory Policy Analysis
- 4.8 Trade Analysis
- 4.9 Price Trend Analysis
- 4.10 Production Cost Analysis
5 Market Size and Growth Forecasts ( Volume)
- 5.1 By Product Type
- 5.1.1 Light Rare Earth Elements
- 5.1.2 Heavy Rare Earth Elements
- 5.2 By Element
- 5.2.1 Cerium
- 5.2.1.1 Oxide
- 5.2.1.2 Sulfide
- 5.2.1.3 Other Compounds
- 5.2.2 Neodymium
- 5.2.2.1 Alloy
- 5.2.3 Lanthanum
- 5.2.3.1 Alloy
- 5.2.3.2 Oxide
- 5.2.3.3 Other Compounds
- 5.2.4 Dysprosium
- 5.2.5 Terbium
- 5.2.6 Yttrium
- 5.2.7 Scandium
- 5.2.8 Other Elements (Promethium, Samarium, etc.)
- 5.2.1 Cerium
- 5.3 By Application
- 5.3.1 Catalysts
- 5.3.2 Ceramics
- 5.3.3 Phosphors
- 5.3.4 Glass and Polishing
- 5.3.5 Metallurgy
- 5.3.6 Magnets
- 5.3.7 Other Applications (Air Cleaning, etc.)
- 5.4 By End-use Industry
- 5.4.1 Clean Energy
- 5.4.2 Consumer Electronics
- 5.4.3 Aerospace and Defense
- 5.4.4 Industrial Automation
- 5.4.5 Healthcare
- 5.4.6 Other End-user Industries (Metallurgy, agriculture, etc.)
- 5.5 By Geography
- 5.5.1 Asia-Pacific
- 5.5.1.1 China
- 5.5.1.2 India
- 5.5.1.3 Japan
- 5.5.1.4 South Korea
- 5.5.1.5 Australia
- 5.5.1.6 Rest of Asia-Pacific
- 5.5.2 North America
- 5.5.2.1 United States
- 5.5.2.2 Canada
- 5.5.2.3 Mexico
- 5.5.3 Europe
- 5.5.3.1 Germany
- 5.5.3.2 United Kingdom
- 5.5.3.3 France
- 5.5.3.4 Italy
- 5.5.3.5 Nordics
- 5.5.3.6 Rest of Europe
- 5.5.4 South America
- 5.5.4.1 Brazil
- 5.5.4.2 Argentina
- 5.5.4.3 Rest of South America
- 5.5.5 Middle-East and Africa
- 5.5.5.1 Saudi Arabia
- 5.5.5.2 United Arab Emirates
- 5.5.5.3 South Africa
- 5.5.5.4 Rest of Middle-East and Africa
- 5.5.1 Asia-Pacific
6 Competitive Landscape
- 6.1 Market Concentration
- 6.2 Strategic Moves
- 6.3 Market Share (%)/Ranking Analysis
- 6.4 Company Profiles (includes Global level Overview, Market level overview, Core Segments, Financials as available, Strategic Information, Market Rank/Share for key companies, Products and Services, and Recent Developments)
- 6.4.1 Appia REU
- 6.4.2 Arafura Rare Earths
- 6.4.3 China Rare Earth Group Resources Technology Co., Ltd.
- 6.4.4 China Rare Earth Holdings Limited
- 6.4.5 ChinaTungsten
- 6.4.6 Energy Fuels Inc.
- 6.4.7 Iluka Resources Limited
- 6.4.8 Jiangxi Copper Corporation
- 6.4.9 Lynas Rare Earths Ltd
- 6.4.10 Mitsubishi Corporation RtM Japan Ltd.
- 6.4.11 MP Materials
- 6.4.12 Northern Minerals
- 6.4.13 Northern Rare Earth
- 6.4.14 Rio Tinto
- 6.4.15 Shenghe Resources Holding Co., Ltd.
- 6.4.16 Texas Mineral Resources Corp.
- 6.4.17 Ucore Rare Metals Inc.
- 6.4.18 Yuyan Rare Earth New Materials Co., Ltd.
7 Market Opportunities and Future Outlook
- 7.1 White-space and Unmet-need Assessment
- 7.2 Growing innovations in exploration and mining technologies

