
PUBLISHER: Mordor Intelligence | PRODUCT CODE: 2043831

PUBLISHER: Mordor Intelligence | PRODUCT CODE: 2043831
Process Automation - Market Share Analysis, Industry Trends & Statistics, Growth Forecasts (2026 - 2031)
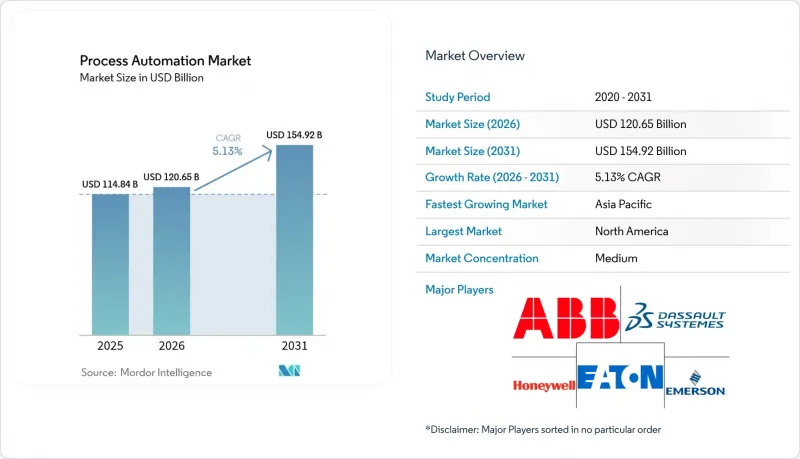
The process automation market size is projected to expand from USD 114.84 billion in 2025 and USD 120.65 billion in 2026 to USD 154.92 billion by 2031, registering a 5.13% CAGR between 2026 to 2031.
The growth curve reflects a broad pivot from reactive maintenance toward predictive, software-defined control architectures that embed artificial intelligence at the edge. Capital budgets are shifting away from cyclic hardware replacements and toward subscription-based manufacturing execution platforms that shorten time-to-insight. Compliance mandates such as pharmaceutical serialization and refinery flare-gas recovery continue to accelerate digital-twin adoption, while petrochemical operators retrofit distributed control systems to optimize volatile feedstock yields. Convergence of operational technology with cloud-native analytics is also expanding the addressable base for edge gateways and secure connectivity layers.
Global Process Automation Market Trends and Insights
Rising Adoption of Robotics
Industrial robot installations hit 553,052 units in 2024, with Asia Pacific accounting for 73% of deployments. Collaborative robots now handle hazardous materials and aseptic fills, reducing ergonomic injuries while maintaining compliance with stringent exposure limits. Talent shortages in remote petrochemical hubs are prompting operators to assign machine-vision-equipped robots to flange inspection and valve actuation. A joint study found that pairing robotics with digital-twin simulations accelerates new-product ramp-up by 22%. Early pilots of humanoid robots in pharmaceutical cleanrooms are underway, with the robots moving items between isolators without breaching Grade A conditions.
Growing Emphasis on Energy Efficiency and Cost Reduction
The European Union earmarked EUR 150 billion (USD 169.5 billion) to decarbonize heavy industry by 2040, explicitly funding upgrades such as variable-frequency drives. The United States Department of Energy identified process heating as 68% of manufacturing energy use and recommended model-predictive control for furnaces. Deployments of AI-driven thermal-management software have cut natural-gas consumption by 14% and delivered payback in less than 18 months, according to vendor filings. Integrated energy-management systems tied directly to distributed control networks have achieved 19% utility savings compared with standalone platforms.
High Initial Capital and Integration Complexity
Brownfield automation projects routinely exceed budgets by 30-40% due to unforeseen protocol mismatches, prompting 62% of North American plants to cite capital constraints as a barrier, despite attractive paybacks. Multi-vendor environments magnify complexity, and hourly rates for system integrators have climbed 18% since 2024. Operators are weighing cloud subscriptions that convert CapEx to OpEx, yet skepticism persists in jurisdictions with strict data-sovereignty rules.
Other drivers and restraints analyzed in the detailed report include:
- Emergence of Industrial Internet of Things (IIoT)
- Demand for Safety Automation Systems
- Cybersecurity Vulnerabilities in OT Networks
For complete list of drivers and restraints, kindly check the Table Of Contents.
Segment Analysis
Manufacturing execution systems experienced the fastest growth trajectory in the process automation market, expanding at a 5.29% CAGR as serial-number traceability and lot genealogy move from optional to mandatory in pharmaceuticals and food production. Programmable logic controllers safeguard their 27.63% market share in core motor and valve loops, yet face commoditization pressure as software-defined control gains mindshare.
Distributed control systems remain indispensable in continuous operations such as refining, where hundreds of loops demand unified historian access and alarm rationalization. Supervisory control and data acquisition platforms cover geographically dispersed pipelines and water utilities, while edge-native human-machine interfaces on tablets and AR headsets trim operator workload. Siemens' unified PCS neo release exemplifies the push to consolidate control and safety functions on a virtualized backbone, thereby shrinking cabinet footprints and simplifying spares management.
Wired Ethernet, fieldbus, and fiber links maintained a dominant 63.72% share of the process automation market in 2025, thanks to deterministic latency and electromagnetic immunity. Wireless connections are projected to grow at a compound annual growth rate (CAGR) of 5.18%, driven by the adoption of private 5G slices. These slices provide guaranteed sub-10-millisecond service levels, which are critical for enabling advanced applications such as mobile robotics and augmented reality (AR) maintenance.
WirelessHART and ISA100.11a support brownfield retrofits without recabling, offering migration paths that appeal to cash-constrained operators. Time-sensitive networking bridges wired and wireless domains by synchronizing endpoints within microseconds, validated in a cross-vendor testbed that delivered servo-class performance. Heightened cybersecurity scrutiny means wireless nodes now ship with WPA3 encryption and certificate management baked in, mitigating the perception gap between copper and air.
The Process Automation Market Report is Segmented by System Type (Valves and Actuators, Electric Motors, and More), Communication Protocol (Wired Protocol, and Wireless Protocol), End-User Industry (Chemical and Petrochemical, Paper and Pulp, Water and Wastewater Treatment, Oil and Gas, Pharmaceutical, and More), Deployment Mode (On-Premise, and Cloud-Based), and Geography. The Market Forecasts are Provided in Terms of Value (USD).
Geography Analysis
North America contributed 33.28% of 2025 revenue, anchored by petrochemical retrofits along the Gulf Coast and water-utility SCADA upgrades funded by the Infrastructure Investment and Jobs Act. A maturing installed base of 1990-era control systems is approaching end-of-support, driving replacements that incorporate encrypted protocols and zero-trust segmentation. Canada's oil-sands operators apply edge analytics to steam-assisted gravity drainage, trimming natural-gas demand when Henry Hub prices spike above USD 3 per MMBtu. Mexico's aerospace and automotive clusters deploy manufacturing execution systems for rules-of-origin traceability under the USMCA framework.
Asia Pacific will expand at a 5.44% CAGR through 2031, propelled by China's 14th Five-Year Plan, which has already certified more than 2,100 lighthouse factories. India's production-linked incentives subsidize automation in pharmaceuticals and food, speeding adoption among small and medium-sized firms. Japan's Society 5.0 vision taps collaborative robots and AR headsets to mitigate labor shortages amid a population that is 29% over 65 years old. South Korea's semiconductor fabs implement advanced process control at 3-nanometer nodes, demonstrating that deterministic loop closure is achievable on converged Ethernet backbones.
Europe enforces energy-monitoring and cybersecurity-by-design mandates via the Clean Industrial Deal and the draft Cyber Resilience Act. Germany's 2025 budget channels EUR 10 billion (USD 11.3 billion) into variable-frequency drives and heat-recovery schemes. The United Kingdom's Advanced Manufacturing Plan offers innovation loans for digital twins, aiming to achieve net-zero manufacturing outcomes by 2040. South America, the Middle East, and Africa trail in installed base yet host megaprojects such as Saudi Arabia's NEOM and Brazil's deepwater presalt fields, which specify IEC 62443 compliance from day one.
- ABB Ltd.
- Dassault Systemes SE
- Eaton Corporation plc
- Emerson Electric Co.
- Honeywell International Inc.
- Johnson Controls International plc
- Mitsubishi Electric Corporation
- Bosch Rexroth AG
- Rockwell Automation Inc.
- Schneider Electric SE
- Siemens AG
- Texas Instruments Inc.
- Yokogawa Electric Corporation
- FANUC Corporation
- KUKA Aktiengesellschaft
- OMRON Corporation
- Keyence Corporation
- General Electric Company
- SEW-Eurodrive GmbH and Co. KG
- Phoenix Contact GmbH and Co. KG
- Advantech Co., Ltd.
- WAGO Kontakttechnik GmbH and Co. KG
- Beckhoff Automation GmbH and Co. KG
Additional Benefits:
- The market estimate (ME) sheet in Excel format
- 3 months of analyst support
TABLE OF CONTENTS
1 INTRODUCTION
- 1.1 Study Assumptions and Market Definition
- 1.2 Scope of the Study
2 RESEARCH METHODOLOGY
3 EXECUTIVE SUMMARY
4 MARKET LANDSCAPE
- 4.1 Market Overview
- 4.2 Market Drivers
- 4.2.1 Rising Adoption of Robotics
- 4.2.2 Growing Emphasis on Energy Efficiency and Cost Reduction
- 4.2.3 Emergence of Industrial Internet of Things (IIoT)
- 4.2.4 Demand for Safety Automation Systems
- 4.2.5 Rise of AI-Driven Predictive Maintenance Platforms
- 4.2.6 Regulatory Push Toward Carbon-Neutral Manufacturing
- 4.3 Market Restraints
- 4.3.1 High Initial Capital and Integration Complexity
- 4.3.2 Cybersecurity Vulnerabilities in OT Networks
- 4.3.3 Shortage of Domain-Specific Automation Talent
- 4.3.4 Legacy Brownfield Interoperability Pitfalls
- 4.4 Industry Ecosystem Analysis
- 4.5 Impact of Macroeconomic Factors
- 4.6 Regulatory Landscape
- 4.7 Porter's Five Forces
- 4.7.1 Bargaining Power of Suppliers
- 4.7.2 Bargaining Power of Buyers
- 4.7.3 Threat of New Entrants
- 4.7.4 Threat of Substitutes
- 4.7.5 Intensity of Competitive Rivalry
5 MARKET SIZE AND GROWTH FORECASTS (VALUE)
- 5.1 By System Type
- 5.1.1 Supervisory Control and Data Acquisition (SCADA)
- 5.1.2 Programmable Logic Controller (PLC)
- 5.1.3 Distributed Control System (DCS)
- 5.1.4 Manufacturing Execution System (MES)
- 5.1.5 Valves and Actuators
- 5.1.6 Electric Motors
- 5.1.7 Human Machine Interface (HMI)
- 5.1.8 Process Safety Systems
- 5.1.9 Sensors and Transmitters
- 5.1.10 Other System Types
- 5.2 By Communication Protocol
- 5.2.1 Wired Protocol
- 5.2.2 Wireless Protocol
- 5.3 By End-User Industry
- 5.3.1 Chemical and Petrochemical
- 5.3.2 Paper and Pulp
- 5.3.3 Water and Wastewater Treatment
- 5.3.4 Energy and Utilities
- 5.3.5 Oil and Gas
- 5.3.6 Pharmaceutical
- 5.3.7 Food and Beverages
- 5.3.8 Other End-User Industries
- 5.4 By Deployment Mode
- 5.4.1 On-premise
- 5.4.2 Cloud-based
- 5.5 By Geography
- 5.5.1 North America
- 5.5.1.1 United States
- 5.5.1.2 Canada
- 5.5.1.3 Mexico
- 5.5.2 South America
- 5.5.2.1 Brazil
- 5.5.2.2 Argentina
- 5.5.2.3 Rest of South America
- 5.5.3 Europe
- 5.5.3.1 Germany
- 5.5.3.2 Italy
- 5.5.3.3 United Kingdom
- 5.5.3.4 France
- 5.5.3.5 Spain
- 5.5.3.6 Rest of Europe
- 5.5.4 Asia-Pacific
- 5.5.4.1 China
- 5.5.4.2 Japan
- 5.5.4.3 India
- 5.5.4.4 South Korea
- 5.5.4.5 Rest of Asia-Pacific
- 5.5.5 Middle East
- 5.5.5.1 Saudi Arabia
- 5.5.5.2 United Arab Emirates
- 5.5.5.3 Turkey
- 5.5.5.4 Rest of Middle East
- 5.5.6 Africa
- 5.5.6.1 South Africa
- 5.5.6.2 Nigeria
- 5.5.6.3 Rest of Africa
- 5.5.1 North America
6 COMPETITIVE LANDSCAPE
- 6.1 Market Concentration
- 6.2 Strategic Moves
- 6.3 Market Share Analysis
- 6.4 Company Profiles (includes Global level Overview, Market level overview, Core Segments, Financials as available, Strategic Information, Market Rank/Share for key companies, Products and Services, and Recent Developments)
- 6.4.1 ABB Ltd.
- 6.4.2 Dassault Systemes SE
- 6.4.3 Eaton Corporation plc
- 6.4.4 Emerson Electric Co.
- 6.4.5 Honeywell International Inc.
- 6.4.6 Johnson Controls International plc
- 6.4.7 Mitsubishi Electric Corporation
- 6.4.8 Bosch Rexroth AG
- 6.4.9 Rockwell Automation Inc.
- 6.4.10 Schneider Electric SE
- 6.4.11 Siemens AG
- 6.4.12 Texas Instruments Inc.
- 6.4.13 Yokogawa Electric Corporation
- 6.4.14 FANUC Corporation
- 6.4.15 KUKA Aktiengesellschaft
- 6.4.16 OMRON Corporation
- 6.4.17 Keyence Corporation
- 6.4.18 General Electric Company
- 6.4.19 SEW-Eurodrive GmbH and Co. KG
- 6.4.20 Phoenix Contact GmbH and Co. KG
- 6.4.21 Advantech Co., Ltd.
- 6.4.22 WAGO Kontakttechnik GmbH and Co. KG
- 6.4.23 Beckhoff Automation GmbH and Co. KG
7 MARKET OPPORTUNITIES AND FUTURE OUTLOOK
- 7.1 White-Space and Unmet-Need Assessment

