PUBLISHER: Mordor Intelligence | PRODUCT CODE: 2043874

PUBLISHER: Mordor Intelligence | PRODUCT CODE: 2043874
Automotive Alternative Fuel Vehicle - Market Share Analysis, Industry Trends & Statistics, Growth Forecasts (2026 - 2031)
The automotive alternative fuel vehicle market size is expected to grow from USD 0.81 trillion in 2025 to USD 0.93 trillion in 2026 and is forecast to reach USD 1.90 trillion by 2031 at a 15.29% CAGR over 2026-2031.
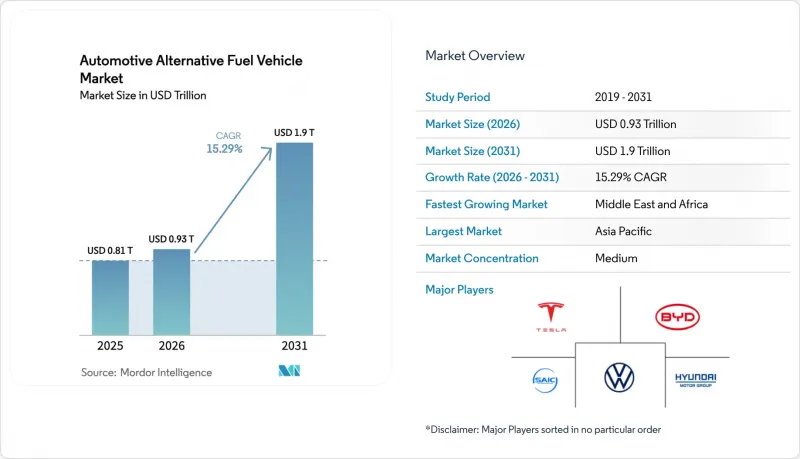
Intensifying decarbonization mandates in the United States, the European Union, China, India, and Japan are compressing the economic window for new internal-combustion launches, nudging buyers toward battery-electric, hydrogen, and gaseous-fuel platforms. Falling battery-pack prices in 2025, alongside hydrogen-tank costs sliding to USD 12 per kilowatt-hour, and fast-charging corridors scaling in three continents together neutralize historical range-anxiety and refueling-time objections. Fleet operators are accelerating purchases to meet Scope 3 reporting obligations, and logistics majors increasingly treat alternative drivetrains as a hedge against diesel-price volatility. Meanwhile, automakers are racing to localize battery supply chains to comply with the United States domestic-content rules and to sidestep the European Union's 2035 combustion-engine sunset clause.
Global Automotive Alternative Fuel Vehicle Market Trends and Insights
Government Decarbonization Mandates and Purchase Incentives
Zero-emission regulations are compressing automaker product-cycle latitude. The United States Inflation Reduction Act extends credits through 2032 and introduces an incentive for used EVs while tightening local-content thresholds. The European Union's fleet-average CO2 target dropped to 93.6 g/km in 2025, with penalties of EUR 95 (~USD 112) per excess gram, which can accumulate to over EUR 1 billion (~USD 1 billion) per carmaker . China's dual-credit scheme awards significant tradable points per battery-electric sale, effectively cross-subsidizing manufacturers that outpace quotas. India's PLI plan channels USD 3.5 billion into cell manufacturing and widens eligibility to fuel-cell two-wheelers. Japan's Green Growth Strategy covers 50% of the incremental cost of fuel-cell cars and ties subsidies to buyers subscribing to certified hydrogen stations.
Rapid Decline in Battery-Pack and H2-Tank Costs
By 2025, advancements in lithium-iron-phosphate chemistry, cell-to-pack integration, and sodium-ion technology significantly reduced battery-pack costs compared to 2022. CATL's Shenxing Plus cells now offer extended range with rapid charging, matching the refueling time of gasoline vehicles. Composite type-IV hydrogen cylinders, being lighter than their metal-lined counterparts, have lowered system costs, enabling adoption in class-8 trucks. BYD has extended warranties to cover longer distances, alleviating concerns about residual values for secondary-market purchasers. Meanwhile, Toyota's early-stage solid-state prototypes have achieved notable energy density improvements, though they're still limited by the scale of electrolyte production.
High Upfront Price Gap vs. ICE Parity Across Several Alt-Fuel Lines
In 2025, compact battery-electric sedans were priced higher than their gasoline counterparts. This price difference stemmed from enhanced infotainment and safety packages added to the electric models to safeguard profit margins. Meanwhile, fuel-cell sedans remained expensive, primarily due to the use of platinum in each stack. However, industry roadmaps aim to reduce platinum usage by 2028. While fleets covering significant distances annually achieved total-cost-of-ownership parity, private owners driving shorter distances faced extended payback periods. In India, entry-level EV batteries constituted a substantial portion of the vehicle's MSRP. This high percentage is attributed to limited small pack volumes, which hinder economies of scale, and import restrictions that drive up component prices.
Other drivers and restraints analyzed in the detailed report include:
- Expansion of EV-Charging / H2-CNG Refueling Corridors
- Fleet-Electrification Commitments by Logistics and E-Commerce Majors
- Grid-Stability Limits on High-Power Charging in Emerging Markets
For complete list of drivers and restraints, kindly check the Table Of Contents.
Segment Analysis
Electric vehicles generated the largest slice of the automotive alternative fuel vehicle market, accounting for 60.12% of revenue. Cost declines in lithium-iron-phosphate cells, fast-charging corridors, and widespread dealer familiarity anchor near-term dominance. Yet growth moderates as early-adopter consumer pools saturate and subsidies step down in several large economies.
Hydrogen platforms, though only a nominal share of 2025 volume, are forecast to compound at 24.01% annually to 2031 as refueling density improves on major freight corridors and as platinum-loading reductions shave the stack cost by 2028. Long-haul trucking, municipal buses, and port-handling equipment value the 15-minute refuel window, retaining asset utilization that bulky batteries would otherwise curtail. CNG, LNG, and LPG retain a niche share, buoyed by 40% pump-price discounts versus diesel in markets with domestic gas production. Meanwhile, mandated ethanol blends keep biofuels at a steady share, supplying a transition solution for regions with vast existing combustion fleets.
Passenger cars dominated revenue in 2025, representing 56.33% of the automotive alternative fuel vehicle market share. Growth, however, flattens as fiscal incentives taper and middle-income households delay purchases pending further price parity. Medium and heavy-duty trucks grow the fastest at a 19.23% CAGR through 2031, underpinned by contractual purchase agreements by retailers and 3PL operators eager to insulate freight rates from diesel volatility.
Dedicated depots allow megawatt chargers or 700-bar hydrogen pumps, compressing payback periods below three years in high-mileage lanes. Two-wheelers and three-wheelers capture outsized unit volumes in India and Southeast Asia, where battery-swap networks sidestep home-charging hurdles. Light commercial vans further illustrate that regenerative braking plus stop-start duty cycles slash energy costs, enticing parcel couriers to commit to electrification road-maps.
The Automotive Alternative Fuel Vehicle Market Report is Segmented by Fuel Type (CNG/LNG/LPG/Autogas, Electric Vehicles, and More), Vehicle Type (Two-Wheelers, Three-Wheelers, and More), Propulsion Technology (Hybrid, Battery-Electric, and More), End-User (Private Users, Fleet Operators, and More), and Geography. The Market Forecasts are Provided in Terms of Both Value (USD) and Volume (Units).
Geography Analysis
Asia-Pacific generated the largest regional turnover in 2025, equal to 38.12% of deliveries, propelled by China's 16.49 million new-energy-vehicle registrations and India's rapidly electrifying two-wheeler segment. Beijing's dual-credit policy obliges automakers to achieve a significant NEV output in 2026, forcing joint-ventures either to ramp proprietary platforms or buy credits, a pressure that effectively subsidizes domestic battery specialists. India's Production-Linked Incentive scheme disburses USD 3.5 billion to localize cell factories, while several states top up purchase grants, enabling electric scooters to underprice gasoline rivals in total cost per kilometer. Japan's hydrogen-roadmap underwrites both station roll-outs and 50% of the incremental price gap per fuel-cell car, yet registrations still trail headline targets. South Korea aligns its policy by linking purchase rebates to specific price range vehicles, nurturing domestic brands Hyundai and Kia.
The Middle East and Africa region, although a small base, is forecast to advance at 17.24% CAGR through 2031. Saudi Arabia's Public Investment Fund finances the Ceer brand's assembly complex, targeting 500,000 annual units by 2030. The United Arab Emirates earmarks a significant number of public chargers by 2030 and permits free parking for zero-emission cars, stimulating premium-segment uptake. South Africa's platinum endowment fosters hydrogen pilot fleets in mining operations, where eliminating diesel ventilates underground shafts more cheaply than fans. Egypt and Turkey leverage tariff exemptions to attract Chinese partnerships that deliver affordable EVs and expand local supplier ecosystems. North African coastal wind and solar resources also underpin green-hydrogen projects aimed at EU synthetic-fuel markets.
North America and Europe each captured a notable share of 2025 revenue. The United States recorded a significant number of EV sales, lifted by the Inflation Reduction Act's generous consumer credits, albeit conditioned on localized battery content. Canada mirrors tax incentives and accelerates East-to-West charging corridor build-outs. Europe posted notable registrations, with Norway uniquely above 90% due to VAT exemptions. Germany's Fit-for-55 policy forces OEMs such as Volkswagen to pledge a significant investment toward electrification, whereas BMW and Mercedes hedge with higher-margin hybrids until infrastructure certainties improve . Brazil continues to exemplify liquid-biofuel leadership, operating flex-fuel cars and blending ethanol at 27%, though EV take-up remains low due to import tariffs on battery packs and charger scarcity.
- Tesla Inc.
- BYD Co. Ltd.
- Toyota Motor Corporation
- Volkswagen AG
- Hyundai Motor Company
- BMW AG
- Mercedes-Benz Group AG
- Ford Motor Company
- General Motors Company
- Honda Motor Co., Ltd.
- Nissan Motor Co., Ltd.
- Kia Corporation
- SAIC Motor Corp.
- Stellantis N.V.
- Volvo Group
- Tata Motors Ltd.
- Audi AG
- Maruti Suzuki Ltd.
Additional Benefits:
- The market estimate (ME) sheet in Excel format
- 3 months of analyst support
TABLE OF CONTENTS
1 Introduction
- 1.1 Study Assumptions and Market Definition
- 1.2 Scope of the Study
2 Research Methodology
3 Executive Summary
4 Market Landscape
- 4.1 Market Overview
- 4.2 Market Drivers
- 4.2.1 Government Decarbonization Mandates and Purchase Incentives
- 4.2.2 Rapid Decline in Battery-Pack and H2-Tank Costs
- 4.2.3 Expansion of EV-Charging / H2-CNG Refueling Corridors
- 4.2.4 Fleet-Electrification Commitments by Logistics and E-Commerce Majors
- 4.2.5 Commercial Pilots of Synthetic Drop-in E-Fuels for Legacy ICE Fleets
- 4.2.6 Growing Adoption of Second-Life Batteries for Stationary Storage
- 4.3 Market Restraints
- 4.3.1 High Upfront Price Gap vs. ICE Parity Across Several Alt-Fuel Lines
- 4.3.2 Grid-Stability Limits on High-Power Charging in Emerging Markets
- 4.3.3 Infrastructure Gaps for H2 and Advanced-Biofuel Supply Chains
- 4.3.4 Volatility in Critical-Mineral Supply Chains (Li, Ni, Co, Pt)
- 4.4 Value / Supply-Chain Analysis
- 4.5 Regulatory Landscape
- 4.6 Technological Outlook
- 4.7 Porter's Five Forces
- 4.7.1 Threat of New Entrants
- 4.7.2 Bargaining Power of Buyers
- 4.7.3 Bargaining Power of Suppliers
- 4.7.4 Threat of Substitutes
- 4.7.5 Competitive Rivalry
5 Market Size & Growth Forecasts (Value (USD) and Volume (Units))
- 5.1 By Fuel Type
- 5.1.1 CNG / LNG / LPG / Autogas
- 5.1.2 Electric Vehicles (EV)
- 5.1.3 Hydrogen Fuel-Cell (FCEV)
- 5.1.4 Biofuels (Ethanol, Biodiesel)
- 5.2 By Vehicle Type
- 5.2.1 Two-Wheelers
- 5.2.2 Three-Wheelers
- 5.2.3 Passenger Cars
- 5.2.4 Light Commercial Vehicles
- 5.2.5 Medium and Heavy-Duty Trucks
- 5.2.6 Buses and Coaches
- 5.2.7 Off-Highway / Construction and Agri Equipment
- 5.3 By Propulsion Technology
- 5.3.1 Hybrid
- 5.3.1.1 Series Hybrid
- 5.3.1.2 Parallel Hybrid
- 5.3.2 Battery-Electric
- 5.3.3 Fuel-Cell Electric
- 5.3.4 Dual-Fuel (CNG-Gasoline / LPG-Gasoline)
- 5.3.1 Hybrid
- 5.4 By End-User
- 5.4.1 Private Users
- 5.4.2 Fleet Operators
- 5.4.3 Government and Municipal Transport
- 5.4.4 Others
- 5.5 By Geography
- 5.5.1 North America
- 5.5.1.1 United States
- 5.5.1.2 Canada
- 5.5.1.3 Rest of North America
- 5.5.2 South America
- 5.5.2.1 Brazil
- 5.5.2.2 Argentina
- 5.5.2.3 Rest of South America
- 5.5.3 Europe
- 5.5.3.1 Germany
- 5.5.3.2 United Kingdom
- 5.5.3.3 France
- 5.5.3.4 Italy
- 5.5.3.5 Spain
- 5.5.3.6 Russia
- 5.5.3.7 Rest of Europe
- 5.5.4 Asia-Pacific
- 5.5.4.1 China
- 5.5.4.2 Japan
- 5.5.4.3 India
- 5.5.4.4 South Korea
- 5.5.4.5 Rest of Asia-Pacific
- 5.5.5 Middle East and Africa
- 5.5.5.1 Saudi Arabia
- 5.5.5.2 United Arab Emirates
- 5.5.5.3 Egypt
- 5.5.5.4 Turkey
- 5.5.5.5 South Africa
- 5.5.5.6 Rest of the Middle East and Africa
- 5.5.1 North America
6 Competitive Landscape
- 6.1 Market Concentration
- 6.2 Strategic Moves
- 6.3 Market Share Analysis
- 6.4 Company Profiles (Includes Global Level Overview, Market Level Overview, Core Segments, Financials as Available, Strategic Information, Market Rank/Share for Key Companies, Products and Services, SWOT Analysis, and Recent Developments)
- 6.4.1 Tesla Inc.
- 6.4.2 BYD Co. Ltd.
- 6.4.3 Toyota Motor Corporation
- 6.4.4 Volkswagen AG
- 6.4.5 Hyundai Motor Company
- 6.4.6 BMW AG
- 6.4.7 Mercedes-Benz Group AG
- 6.4.8 Ford Motor Company
- 6.4.9 General Motors Company
- 6.4.10 Honda Motor Co., Ltd.
- 6.4.11 Nissan Motor Co., Ltd.
- 6.4.12 Kia Corporation
- 6.4.13 SAIC Motor Corp.
- 6.4.14 Stellantis N.V.
- 6.4.15 Volvo Group
- 6.4.16 Tata Motors Ltd.
- 6.4.17 Audi AG
- 6.4.18 Maruti Suzuki Ltd.
7 Market Opportunities and Future Outlook
- 7.1 White-space and Unmet-Need Assessment

