PUBLISHER: Mordor Intelligence | PRODUCT CODE: 2043898

PUBLISHER: Mordor Intelligence | PRODUCT CODE: 2043898
Office Real Estate - Market Share Analysis, Industry Trends & Statistics, Growth Forecasts (2026 - 2031)
The Office Real Estate Market size is expected to increase from USD 1.64 trillion in 2025 to USD 1.71 trillion in 2026 and reach USD 2.14 trillion by 2031, growing at a CAGR of 4.53% over 2026-2031.
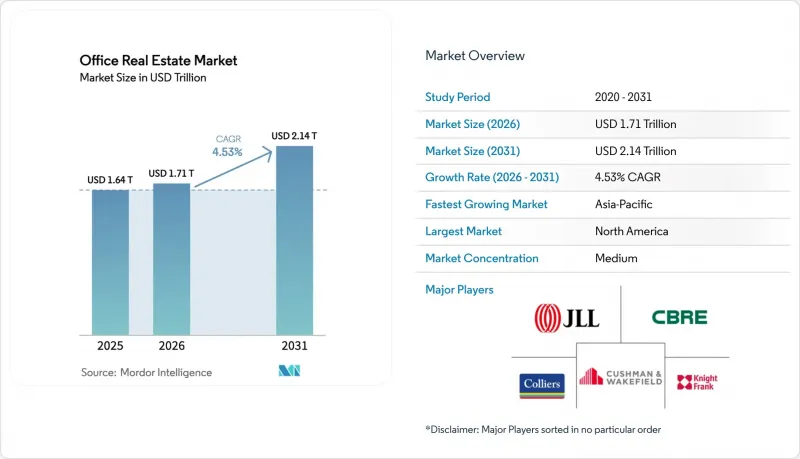
A widening performance gap defines today's cycle: ESG-certified towers located in AI-centric corridors and in regions with government headquarters mandates are attracting both capital and tenants, while secondary stock faces double-digit vacancy and refinancing stress. Return-to-office rules have stabilized weekday occupancy at roughly three days per employee, yet occupiers now insist on healthier air systems, superior amenities, and green credentials that satisfy Scope-3 reporting. Institutional investors that marked down holdings in 2023 are selectively re-entering, favoring prime assets in gateway cities where LEED or BREEAM labels deliver rent premiums and regulatory headroom. A record-low construction pipeline since 2024 further tightens prime vacancy, giving landlords pricing power for the first time since 2019. At the same time, a USD 929 billion CMBS maturity wall through 2027 is pushing leveraged owners of Class B and C towers toward distressed sales rather than retrofits, deepening the bifurcation.
Global Office Real Estate Market Trends and Insights
Flight-to-Quality and Mandated Returns Lift Demand for ESG-Prime Assets
Mandatory on-site policies at major banks and professional-services firms have steered tenants toward buildings that make commuting worthwhile. Wells of demand concentrate on towers carrying LEED v5, BREEAM v7, or WELL Health-Safety badges that now command 8-12% rent premiums over uncertified peers in New York, London, and Singapore. Landlords racing to capture this premium are investing USD 15-25 per square foot in advanced HVAC, circadian lighting, and touchless access to reduce absenteeism and reinforce brand equity. The trend aligns with corporate Scope-3 reporting rules, making green space a compliance tool rather than a perk. As a result, prime vacancy in core submarkets sits below 10%, while secondary and tertiary assets register vacancies above 20%, confirming a secular flight-to-quality split.
Record-Low New Construction Tightens Prime Vacancies
U.S. office deliveries dropped to 38 million square feet in 2024, the lowest total since 2009, because high financing costs and uncertain leasing halted groundbreaks. Scarce supply has pushed Class A vacancy below 8% in Manhattan's Hudson Yards, San Francisco's Mission Bay, and Seattle's Denny Triangle, enabling landlords to secure rent escalations that outrun inflation. The shortage is most acute for contiguous blocks of 50,000 square feet or more, space coveted by AI developers and chip designers who require dense power and collaboration zones. Tech giants now pre-lease years in advance; Nvidia reserved a 500,000-square-foot tower in Santa Clara for 2027 occupancy. Such early commitments are feeding a virtuous cycle of higher asking rents and rising stabilized values for the limited cohort of still-pipeline prime projects.
Structural Vacancy in Obsolete Assets Persists
Class B and C towers lacking modern HVAC, fiber backbones, or 9-foot clear heights endure vacancy rates above 20% in multiple U.S. metros. Goldman Sachs calculates that 330 million square feet, 8% of the national supply, is functionally obsolete and headed for adaptive reuse or demolition by 2030. In Europe, Savills warns that 25% of London offices will miss EPC Band B compliance, likely stranding capital and pushing tenants to greener premises. Conversion economics only work when acquisition costs fall below USD 150 per square foot, a hurdle met by fewer than 15% of listings, prolonging vacancy and hitting local tax bases. Until pricing clears or incentives emerge, obsolete stock will drag absorption and dilute the sector's aggregate performance.
Other drivers and restraints analyzed in the detailed report include:
- Easing Rates and Repricing Draw Institutions Back to Core Offices
- AI and Semiconductor Corridors Spur Large-Block Leasing
- 2025-27 Refinancing Wall Raises Distress and Limits Capex
For complete list of drivers and restraints, kindly check the Table Of Contents.
Segment Analysis
Grade A towers controlled 56.94% of the office real estate market share in 2025, and this cohort will compound at a 5.27% CAGR through 2031, underscoring an investor and tenant pivot toward energy-efficient, amenity-rich space. The office real estate market size for Grade A stock equated to roughly USD 975 billion in 2026, a figure that captures growing allocations from pension funds and sovereign wealth vehicles. Vacancy gaps prove decisive: Manhattan Class A was 9.8% in late 2024 versus 22.1% for Class C, while similar spreads appeared in London's West End and Singapore's Raffles Place.
Capital constraints accelerate divergence. Lenders offer 70% LTV on well-leased Grade A towers but cap leverage at 50% for mid-grade assets, forcing owners of older stock to defer maintenance. European directives that all buildings hit EPC Band B by 2030 compound the pressure. Investors expect a green premium; accordingly, net-zero-ready buildings transacted at cap rates 50-75 basis points firmer than non-compliant peers in 2025. Over the forecast horizon, institutional capital will continue to gravitate toward prime, compressing yields and widening value gaps across grades.
The Office Real Estate Market Report is Segmented by Building Grade (Grade A, Grade B, Grade C), by Transaction Type (Rental, Sales), by End Use (IT & ITES, BFSI, Business Consulting & Professional Services, Other Services), and by Geography (North America, South America, Europe, Middle East and Africa, Asia-Pacific). The Market Forecasts are Provided in Terms of Value (USD).
Geography Analysis
North America held 26.84% of the 2025 office real estate market share, buoyed by prime submarkets such as Manhattan's Hudson Yards, San Francisco's Mission Bay, and Seattle's Denny Triangle, each with Class A vacancy below 8% in late 2024. Canada's Toronto and Vancouver attract U.S. technology and gaming firms that value immigration-friendly labor pools; Class A absorption in Toronto hit 1.8 million square feet during 2024. Refinancing risk clouds the region, however, as USD 929 billion of CMBS debt approaches maturity, threatening leveraged owners of mid-tier properties with forced sales that widen the quality divide.
The office real estate market in asia-pacific is poised for the fastest 5.95% CAGR through 2031, driven by resilient demand in China's tier-1 cities, India's Bengaluru-Mumbai corridor, and Japan's core wards. Beijing's CBD and Shanghai's Lujiazui absorbed 4.2 million square feet in 2024 as foreign enterprises renewed growth plans, while India posted a record 52 million square feet of national absorption, 18 million of which landed in Bengaluru alone. Tokyo's Grade A vacancy sank to 3.1% in Q3 2024 on the back of corporate consolidations spurred by governance reforms. Australia's Sydney and Melbourne markets stabilize as hybrid work settles at 2.8 days on-site, with tenants prioritizing buildings sporting NABERS 5-star ratings.
The office real estate market in europe faces twin headwinds of EPC compliance and refinancing hurdles, yet prime districts retain depth. London's City and West End vacancies eased to 12.8% in late 2024 as banking and legal tenants recommitted to new towers carrying BREEAM Outstanding labels. Germany's Frankfurt and Munich absorb automotive-linked growth, constrained more by construction-cost inflation than demand. Paris La Defense draws occupiers relocating from inefficient Haussmann buildings, and combined Grade A absorption reached 420,000 square meters in 2024. In the Middle East, Saudi Arabia and the UAE's incentives compress prime vacancy, whereas South America's Sao Paulo rebounds modestly as currency volatility eases, lowering vacancy to 14.6% in Q4 2024.
List of Companies Covered in this Report:
- CBRE Group
- Jones Lang LaSalle (JLL)
- Cushman & Wakefield
- Colliers International
- Knight Frank
- Savills
- Brookfield Properties
- Boston Properties
- SL Green Realty
- Vornado Realty Trust
- Hines
- Skanska
- China Evergrande Group
- DLF (Delhi Land & Finance)
- Gecina
- Derwent London
- Dexus
- Mitsubishi Estate
- Suntec REIT
- Buckingham Properties
Additional Benefits:
- The market estimate (ME) sheet in Excel format
- 3 months of analyst support
TABLE OF CONTENTS
1 Introduction
- 1.1 Study Assumptions & Market Definition
- 1.2 Scope of the Study
2 Research Methodology
3 Executive Summary
4 Market Insights and Dynamics
- 4.1 Market Overview
- 4.2 Market Drivers
- 4.2.1 Flight-to-quality & mandated returns raise demand for ESG-certified prime assets
- 4.2.2 Record-low new construction pipeline tightening prime vacancies
- 4.2.3 Easing rates & repricing lure institutional capital back to core offices
- 4.2.4 AI & semiconductor mega-hubs driving large tech-corridor leasing
- 4.2.5 GCC regional HQ mandates (e.g., Saudi) fueling Middle-East trophy demand
- 4.2.6 Scope-3 decarbonization deadlines accelerating green retrofits
- 4.3 Market Restraints
- 4.3.1 Structural vacancy in secondary & obsolete assets persists
- 4.3.2 Wall of 2025-27 refinancing increases distress & limits capex
- 4.3.3 Sticky construction & fit-out cost inflation squeezes project returns
- 4.3.4 AI-driven desk-sharing cuts per-employee space allocation
- 4.4 Government Regulations and Initiatives in the Industry
- 4.5 Technological Innovations in the Office Real Estate Market
- 4.6 Insights into Rental Yields in the Office Real Estate Segment
- 4.7 Insights into the Key Office Real Estate Industry Metrics (Supply, Rentals, Prices, Occupancy/Vacancy (%))
- 4.8 Insights into Office Real Estate Construction Costs
- 4.9 Insights into Office Real Estate Investment
- 4.10 Impact of Remote Working on Space Demand
- 4.11 Industry Attractiveness - Porter's Five Forces
- 4.11.1 Threat of New Entrants
- 4.11.2 Bargaining Power of Buyers / Occupiers
- 4.11.3 Bargaining Power of Developers / Landlords
- 4.11.4 Threat of Substitutes (WFH, Flexible Space)
- 4.11.5 Competitive Rivalry
5 Market Size & Growth Forecasts (Value, In USD Billion)
- 5.1 By Building Grade
- 5.1.1 Grade A
- 5.1.2 Grade B
- 5.1.3 Grade C
- 5.2 By Transaction Type
- 5.2.1 Rental
- 5.2.2 Sales
- 5.3 By End User
- 5.3.1 Information Technology (IT & ITES)
- 5.3.2 BFSI (Banking, Financial Services and Insurance)
- 5.3.3 Business Consulting & Professional Services
- 5.3.4 Other Services (Retail, Lifescience, Energy, Legal)
- 5.4 By Geography
- 5.4.1 North America
- 5.4.1.1 United States
- 5.4.1.2 Canada
- 5.4.1.3 Mexico
- 5.4.2 South America
- 5.4.2.1 Brazil
- 5.4.2.2 Argentina
- 5.4.2.3 Chile
- 5.4.2.4 Rest of South America
- 5.4.3 Europe
- 5.4.3.1 United Kingdom
- 5.4.3.2 Germany
- 5.4.3.3 France
- 5.4.3.4 Italy
- 5.4.3.5 Spain
- 5.4.3.6 Netherlands
- 5.4.3.7 Rest of Europe
- 5.4.4 Middle East and Africa
- 5.4.4.1 Saudi Arabia
- 5.4.4.2 United Arab Emirates
- 5.4.4.3 South Africa
- 5.4.4.4 Nigeria
- 5.4.4.5 Rest of Middle East and Africa
- 5.4.5 Asia-Pacific
- 5.4.5.1 China
- 5.4.5.2 India
- 5.4.5.3 Japan
- 5.4.5.4 South Korea
- 5.4.5.5 Australia
- 5.4.5.6 Indonesia
- 5.4.5.7 Rest of Asia-Pacific
- 5.4.1 North America
6 Competitive Landscape
- 6.1 Market Concentration
- 6.2 Strategic Moves
- 6.3 Company Profiles (includes Global level Overview, Market level overview, Core Segments, Financials as available, Strategic Information, Products & Services, and Recent Developments)
- 6.3.1 CBRE Group
- 6.3.2 Jones Lang LaSalle (JLL)
- 6.3.3 Cushman & Wakefield
- 6.3.4 Colliers International
- 6.3.5 Knight Frank
- 6.3.6 Savills
- 6.3.7 Brookfield Properties
- 6.3.8 Boston Properties
- 6.3.9 SL Green Realty
- 6.3.10 Vornado Realty Trust
- 6.3.11 Hines
- 6.3.12 Skanska
- 6.3.13 China Evergrande Group
- 6.3.14 DLF (Delhi Land & Finance)
- 6.3.15 Gecina
- 6.3.16 Derwent London
- 6.3.17 Dexus
- 6.3.18 Mitsubishi Estate
- 6.3.19 Suntec REIT
- 6.3.20 Buckingham Properties
7 Market Opportunities & Future Outlook

