
PUBLISHER: Mordor Intelligence | PRODUCT CODE: 2043903

PUBLISHER: Mordor Intelligence | PRODUCT CODE: 2043903
GCC Electric Vehicle - Market Share Analysis, Industry Trends & Statistics, Growth Forecasts (2026 - 2031)
The GCC electric vehicle market size will rise from USD 9.53 billion in 2025 to USD 11.64 billion in 2026, reaching USD 31.66 billion by 2031, expanding at a CAGR of 22.15% over 2026-2031.
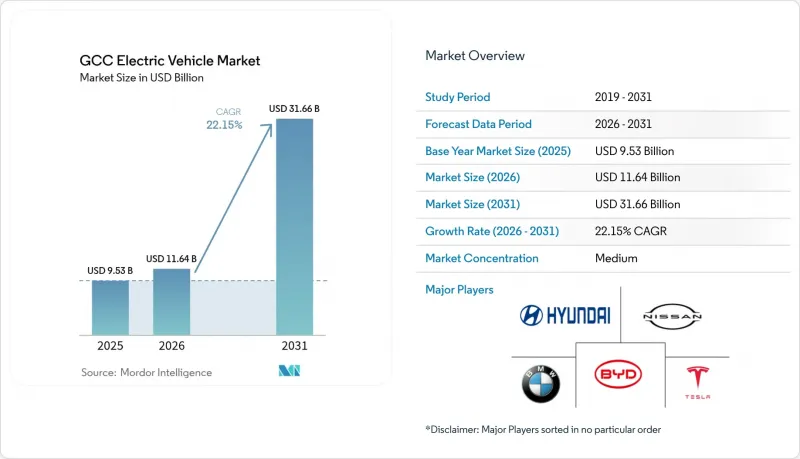
Early-mover policy mandates, sovereign-wealth funding, and a rapid build-out of ultra-fast public chargers are synchronizing to accelerate adoption across every Gulf state. Automakers are localizing assembly to trim landed costs, while battery suppliers court regional gigafactory proposals that promise deeper supply-chain integration. Commercial fleets are electrifying faster as the total cost of ownership becomes more favorable, yet passenger cars still dominate absolute volumes. Competition remains moderate because no single brand controls more than 15% of the GCC electric vehicle market, creating space for regional entrants to win government and corporate tenders.
GCC Electric Vehicle Market Trends and Insights
Government Decarbonization Mandates and Zero-Emission Targets
National programs such as Saudi Vision 2030's 30% zero-emission vehicle goal for Riyadh and the UAE Climate Change Plan's 50% cut in transport emissions are locking in long-term demand signals. These mandates compel automakers to allocate production slots to the GCC electric vehicle market before other regions. Tier-1 suppliers are now scouting factory sites in Jeddah and Abu Dhabi to meet local content requirements. Fleet tenders embed zero-emission clauses, forcing bus and taxi operators to adopt electric drivetrains. As compliance windows tighten, incremental incentives such as reduced registration fees amplify consumer pull.
Automaker Capital Expenditure on Regional Assembly Plants
Ceer Motors, Lucid, and Hyundai together committed more than USD 5 billion to Saudi assembly capacity slated to start output in 2026. Local build lowers shipping and duty costs that historically inflated sticker prices in the GCC electric vehicle market. Assembly footprints anchor ancillary suppliers, nurturing a regional parts ecosystem. Shorter supply chains cut lead times, letting dealers hold leaner inventory. Over time, assembly plants may pivot to export, enhancing utilization and cost efficiency.
High Upfront EV Purchase Price Vs ICE Parity
Sticker prices remain significantly above internal-combustion equivalents across most Gulf showrooms, despite falling battery costs. Chinese brands partially bridge the gap below USD 35,000, yet luxury trims skew segment averages higher. Import duties in Kuwait and legacy financing norms elsewhere inflate effective ownership costs. Domestic assembly should shave 10-15% from prices as plants ramp, but broad parity for mass-market buyers is unlikely before 2027. Short-term subsidies or fee waivers can soften the transition for price-sensitive households.
Other drivers and restraints analyzed in the detailed report include:
- Rapid Expansion of Public Charging Infrastructure
- Falling Lithium-Ion Battery Pack Costs
- Limited Model Availability for Extreme-Temperature Climates
For complete list of drivers and restraints, kindly check the Table Of Contents.
Segment Analysis
Passenger cars accounted for 79.92% of the GCC electric vehicle market share in 2025, underscoring the early dominance of private purchases. However, fleet operators' focus on predictable duty cycles and bulk-energy contracts is steadily tilting momentum toward vans, buses, and trucks. Public-sector procurement aligns with low-emission targets, and logistics firms cite maintenance and fuel savings as pivotal factors. Depot-based overnight charging simplifies energy management, while governments grant preferential electricity tariffs to high-utilization fleets.
Commercial vehicles, expanding at a 23.22% CAGR through 2031, underscore the structural shift underway. Cities from Riyadh to Doha earmark dedicated bus lanes for zero-emission units, reinforcing modal confidence. Parcel-delivery networks deploy electric light vans that dovetail with e-commerce surge patterns. Pilot programs in medium-duty freight refine performance data under desert conditions, preparing the segment for scale. As corporate buyers aggregate demand, OEMs can justify sourcing chassis and batteries locally.
Battery electric vehicles captured 67.83% of the GCC electric vehicle market size in 2025 by leveraging ubiquitous charger roll-outs and competitive total ownership costs. Incremental improvements in pack energy density address range anxiety for most daily routes. In tandem, software-based thermal controls mitigate degradation caused by high ambient heat, extending the usable lifespan. Fuel-cell electric vehicles are projected to deliver the fastest 23.98% CAGR through 2031, driven by funded green-hydrogen megaprojects in Saudi Arabia and Oman.
Three-minute refueling and heavy-load suitability position FCEVs as credible solutions for long-haul freight and intercity coaches. Early corridors anchor refueling nodes at existing truck stops, promoting operational familiarity. Policy makers monitor hydrogen price trajectories, aiming for sub-USD 4-per-kilogram parity milestones that could further diversify the GCC electric vehicle market's propulsion mix.
The GCC Electric Vehicle Market Report is Segmented by Vehicle Type (Passenger Cars and Commercial Vehicles), Propulsion Type (Battery Electric Vehicles and More), Battery Capacity (Below 40 KWh and More), Charging Infrastructure (AC Slow Chargers and More), Ownership Model (Private Individual and More), Price Segment (Economy and More), and Country. The Market Forecasts are Provided in Terms of Value (USD) and Volume (Units).
List of Companies Covered in this Report:
- Tesla, Inc.
- Nissan Motor Co., Ltd.
- Hyundai Motor Company
- Volkswagen AG
- General Motors Company
- Toyota Motor Corporation
- Groupe Renault
- NWTN Motors
- BMW AG
- Audi AG
- Ceer Motors
- Barq EV
- Lucid Group, Inc.
- BYD Company Limited
- SAIC Motor Corp. (MG)
- Geely Auto Holdings (Zeekr)
- Chery Automobile Co.
- W Motors
- Rivian Automotive, Inc.
- Polestar Automotive Holding
- VinFast Auto
- Foxconn / MIH Consortium
- Stellantis N.V.
- Kia Corporation
Additional Benefits:
- The market estimate (ME) sheet in Excel format
- 3 months of analyst support
TABLE OF CONTENTS
1 Introduction
- 1.1 Study Assumptions and Market Definition
- 1.2 Scope of the Study
2 Research Methodology
3 Executive Summary
4 Market Landscape
- 4.1 Market Overview
- 4.2 Market Drivers
- 4.2.1 Government Decarbonization Mandates and Zero-Emission Targets
- 4.2.2 Automaker Capital Expenditure on Regional Assembly Plants
- 4.2.3 Rapid Expansion of Public Charging Infrastructure
- 4.2.4 Falling Lithium-Ion Battery Pack Costs
- 4.2.5 Sovereign Wealth Fund Equity in Niche EV Start-Ups
- 4.2.6 Cross-Border Green-Hydrogen Corridors for FCEVs
- 4.3 Market Restraints
- 4.3.1 High Upfront EV Purchase Price Vs ICE Parity
- 4.3.2 Limited Model Availability for Extreme-Temperature Climates
- 4.3.3 Grid-Scale Desalination-EV Load Competition Raising Tariffs
- 4.3.4 Conservative Sharia-Compliant Auto-Financing Structures
- 4.4 Value / Supply-Chain Analysis
- 4.5 Regulatory Landscape
- 4.6 Technological Outlook
- 4.7 Porter's Five Forces Analysis
- 4.7.1 Bargaining Power of Suppliers
- 4.7.2 Bargaining Power of Buyers/Consumers
- 4.7.3 Threat of New Entrants
- 4.7.4 Threat of Substitute Products
- 4.7.5 Intensity of Competitive Rivalry
5 Market Size and Growth Forecasts (Value (USD) and Volume (Units))
- 5.1 By Vehicle Type
- 5.1.1 Passenger Cars
- 5.1.1.1 Hatchbacks
- 5.1.1.2 Sedans
- 5.1.1.3 SUVs and Crossovers
- 5.1.2 Commercial Vehicles
- 5.1.2.1 Light Commercial Vans
- 5.1.2.2 Buses and Coaches
- 5.1.2.3 Medium and Heavy Trucks
- 5.1.1 Passenger Cars
- 5.2 By Propulsion Type
- 5.2.1 Battery Electric Vehicles (BEV)
- 5.2.2 Plug-in Hybrid Electric Vehicles (PHEV)
- 5.2.3 Hybrid Electric Vehicles (HEV)
- 5.2.4 Fuel Cell Electric Vehicles (FCEV)
- 5.3 By Battery Capacity (kWh Range)
- 5.3.1 Below 40 kWh
- 5.3.2 40 to 60 kWh
- 5.3.3 61 to 100 kWh
- 5.3.4 Above 100 kWh
- 5.4 By Charging Infrastructure Type
- 5.4.1 AC Slow Chargers (Below 22 kW)
- 5.4.2 DC Fast Chargers (22 to 150 kW)
- 5.4.3 Ultra-Fast Chargers (Above 150 kW)
- 5.4.4 Battery Swap Stations
- 5.5 By Ownership Model
- 5.5.1 Private Individual
- 5.5.2 Corporate Fleet
- 5.5.3 Ride-hailing / Car-sharing
- 5.5.4 Government and Municipal
- 5.6 By Price Segment
- 5.6.1 Economy (Below USD 35k)
- 5.6.2 Mid-range (USD 35k to 60k)
- 5.6.3 Luxury (Above USD 60k)
- 5.7 By Country
- 5.7.1 United Arab Emirates
- 5.7.2 Saudi Arabia
- 5.7.3 Qatar
- 5.7.4 Oman
- 5.7.5 Kuwait
- 5.7.6 Bahrain
6 Competitive Landscape
- 6.1 Market Concentration
- 6.2 Strategic Moves
- 6.3 Market Share Analysis
- 6.4 Company Profiles (Includes Global level Overview, Market level overview, Core Segments, Financials as available, Strategic Information, Market Rank/Share for key companies, Products and Services, and Recent Developments)
- 6.4.1 Tesla, Inc.
- 6.4.2 Nissan Motor Co., Ltd.
- 6.4.3 Hyundai Motor Company
- 6.4.4 Volkswagen AG
- 6.4.5 General Motors Company
- 6.4.6 Toyota Motor Corporation
- 6.4.7 Groupe Renault
- 6.4.8 NWTN Motors
- 6.4.9 BMW AG
- 6.4.10 Audi AG
- 6.4.11 Ceer Motors
- 6.4.12 Barq EV
- 6.4.13 Lucid Group, Inc.
- 6.4.14 BYD Company Limited
- 6.4.15 SAIC Motor Corp. (MG)
- 6.4.16 Geely Auto Holdings (Zeekr)
- 6.4.17 Chery Automobile Co.
- 6.4.18 W Motors
- 6.4.19 Rivian Automotive, Inc.
- 6.4.20 Polestar Automotive Holding
- 6.4.21 VinFast Auto
- 6.4.22 Foxconn / MIH Consortium
- 6.4.23 Stellantis N.V.
- 6.4.24 Kia Corporation
7 Market Opportunities and Future Outlook
- 7.1 White-space and unmet-need assessment

