
PUBLISHER: Mordor Intelligence | PRODUCT CODE: 2043920

PUBLISHER: Mordor Intelligence | PRODUCT CODE: 2043920
Pharmaceutical Equipment - Market Share Analysis, Industry Trends & Statistics, Growth Forecasts (2026 - 2031)
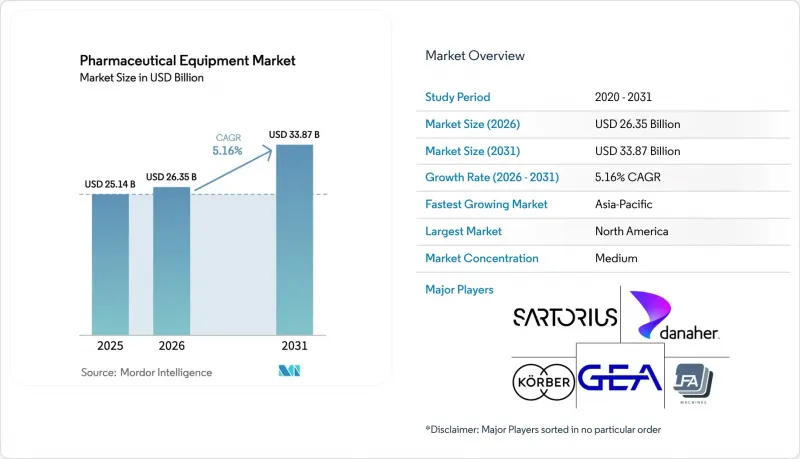
The pharmaceutical equipment market size is expected to increase from USD 25.93 billion in 2025 to USD 27.10 billion in 2026 and reach USD 33.79 billion by 2031, growing at a CAGR of 4.51% over 2026-2031.
Demand pivots toward biologics, which now account for 62% of pre-clinical and clinical manufacturing runs, prompting suppliers to replace monolithic stainless-steel installations with modular, single-use assemblies that cut validation timelines from 18 months to under 6 months. Contract development and manufacturing organizations (CDMOs) are consolidating purchasing power; they consumed 28% of global bioreactor capacity in 2024 and are projected to command 38% by 2028, accelerating investment in continuous-flow production skids. Regulatory change intensifies upgrade cycles: the European Medicines Agency's Annex 1 revision obliges isolators or restricted-access barrier systems (RABS) across roughly 1,200 European fill-finish suites, driving a multiyear retrofit backlog. Meanwhile, the U.S. Food and Drug Administration (FDA) fast-tracks applications that deploy advanced manufacturing technologies, shortening commercial approval by 6 to 9 months and accelerating capital spending.
Global Pharmaceutical Equipment Market Trends and Insights
Rising Biologics Manufacturing Volumes
Biologics commanded 85% of pipeline manufacturing runs in 2024, pushing installed global bioreactor volume from 6.7 million L to an expected 8.9 million L by 2028. Viral-vector lines are most constrained, with 18-24-month equipment lead times that limit gene-therapy launches. New product pipelines encourage co-location of upstream and fill-finish assets, trimming batch transfer by 40% and simplifying contamination control.
Accelerated Adoption of Single-Use Technologies
Single-use systems reached USD 27.8 billion in 2025 and are now deployed in 62% of commercial batches, saving users millions in cleaning-validation downtime. CDMOs value the 14-day campaign changeovers versus 45-60 days for stainless-steel lines, unlocking higher asset utilization. Supply-chain fragility persists: a 2024 polymer-film plant fire disrupted bag deliveries for 4 months and raised spot prices by 15% across Europe.
Other drivers and restraints analyzed in the detailed report include:
- Stringent GMP-Driven Equipment Upgrades
- Expansion of Contract Manufacturing Capacity
- High Capital Investment & Long Payback
- Supply-Chain Shortages of Critical Components
For complete list of drivers and restraints, kindly check the Table Of Contents.
Segment Analysis
Aseptic fill-finish platforms captured 29.55% of the pharmaceutical equipment market share in 2025 amid the boom in pre-filled syringes and autoinjectors for GLP-1 agonists and monoclonal antibodies. Quality-control instrumentation is forecast to grow 4.85% annually through 2031 as regulators require 100% visual inspection and real-time release testing. Upstream bioprocess skids benefit from a 33% surge in mammalian capacity, yet Chinese vendors undercut Western prices by up to 40%, squeezing margins.
Downstream purification assets, a gating step, run at >85% utilization in leading CDMOs, with each 2,000 L batch cycling through 8-12 chromatography passes and consuming 4-6 hours per pass. Serialization mandates raise primary and secondary packaging line costs by USD 1.5-2.5 million per installation, while Annex 1 drives higher HVAC and water-for-injection expenditure. The pharmaceutical equipment market size tied to lyophilizers and homogenizers trails the broader average as oral-solid dose output migrates to lower-cost sites.
The Pharmaceutical Equipment Market Report is Segmented by Equipment Type (Upstream Bioprocess Equipment, Downstream Purification Equipment, and More), Manufacturing Stage (Drug Substance Production, Drug Product Formulation, and More), End User (Pharmaceutical Manufacturing Companies, and More), and Geography (North America, Europe, Asia-Pacific, and More). The Market Forecasts are Provided in Terms of Value (USD).
Geography Analysis
North America accounted for 42.52% of the pharmaceutical equipment market revenue in 2025, supported by 3.1 million L of installed bioreactor volume and expedited FDA reviews that shorten approval cycles by up to 9 months. BARDA investments establish rapid-deployment modules in Texas, North Carolina, and Maryland, while Canada's USD 370 million regenerative-medicine hub enhances clinical-stage capacity. Mexico leverages labor savings of 40-50% to attract three U.S. fill-finish expansions.
Asia-Pacific is projected to grow 5.12% CAGR through 2031, spearheaded by China's 1.2 million L capacity boost and India's INR 150 billion PLI incentives for APIs and biologics. South Korea and Singapore host major CDMO clusters, whereas Japan automates to offset labor deficits, implementing 18 collaborative robots across inspection cells.
Europe faces elevated energy costs, with German electricity tariffs up 22% in 2024, yet it remains the innovation nucleus for single-use components, housing 9 of the top 15 suppliers. Annex 1 drives a USD 3 billion retrofit boom, led by Germany, the UK, and France. Southern Europe is emerging as a biosimilar fill-finish hub, driven by lower labor costs, despite slightly longer regulatory timelines. Middle East-Africa and South America remain small but strategically important. Saudi Arabia commits USD 3.2 billion to cut drug import reliance to 50% by 2030. South Africa's Biovac secured Pfizer partnership for mRNA fill-finish, the continent's first WHO-prequalified line. Brazil's state-run Biomanguinhos installed a 2,000 L single-use reactor in 2025, but under-investment in quality control curbs export readiness.
- ACG Worldwide
- Colanar AG
- Danaher (Cytiva & Pall)
- Esco Lifesciences
- GEA Group
- IMA Group
- Korber Pharma
- Merck KGaA (MilliporeSigma)
- Optima Packaging
- Pall
- Romaco Group
- Sartorius
- Shinva Medical
- Stevanato Group
- Syntegon Technology
- Thermo Fisher Scientific
- Tofflon Science & Technology
- Truking Technology
Additional Benefits:
- The market estimate (ME) sheet in Excel format
- 3 months of analyst support
TABLE OF CONTENTS
1 Introduction
- 1.1 Study Assumptions & Market Definition
- 1.2 Scope of the Study
2 Research Methodology
3 Executive Summary
4 Market Landscape
- 4.1 Market Overview
- 4.2 Market Drivers
- 4.2.1 Rising Biologics Manufacturing Volumes
- 4.2.2 Accelerated Adoption of Single-Use Tech
- 4.2.3 Stringent GMP-Driven Equipment Upgrades
- 4.2.4 Expansion of Contract Manufacturing Capacity
- 4.2.5 Shift Toward Continuous Manufacturing Lines
- 4.2.6 Pharma 4.0 Predictive-Maintenance Retrofits
- 4.3 Market Restraints
- 4.3.1 High Capital Investment & Long Payback
- 4.3.2 Supply-Chain Shortages of Critical Components
- 4.3.3 Multi-Jurisdiction Approval Complexity
- 4.3.4 Skilled-Labor Gap in Emerging Markets
- 4.4 Supply-Chain Analysis
- 4.5 Regulatory Landscape
- 4.6 Technological Outlook
- 4.7 Porter's Five Forces Analysis
- 4.7.1 Threat of New Entrants
- 4.7.2 Bargaining Power of Suppliers
- 4.7.3 Bargaining Power of Buyers
- 4.7.4 Threat of Substitutes
- 4.7.5 Competitive Rivalry
5 Market Size & Growth Forecasts (Value, USD)
- 5.1 By Equipment Type
- 5.1.1 Upstream Bioprocess Equipment
- 5.1.2 Downstream Purification Equipment
- 5.1.3 Aseptic Fill-Finish Systems
- 5.1.4 Primary & Secondary Packaging Lines
- 5.1.5 Quality-Control & Inspection Instruments
- 5.1.6 Ancillary Utilities (HVAC, CIP/SIP, etc.)
- 5.1.7 Others
- 5.2 By Manufacturing Stage
- 5.2.1 Drug Substance Production
- 5.2.2 Drug Product Formulation
- 5.2.3 Fill-Finish
- 5.2.4 Final Packaging & Labelling
- 5.2.5 Quality-Control & Release Testing
- 5.3 By End User
- 5.3.1 Pharmaceutical Manufacturing Companies
- 5.3.2 Contract Development & Manufacturing Orgs (CDMOs/CMOs)
- 5.3.3 Others
- 5.4 By Geography
- 5.4.1 North America
- 5.4.1.1 United States
- 5.4.1.2 Canada
- 5.4.1.3 Mexico
- 5.4.2 Europe
- 5.4.2.1 Germany
- 5.4.2.2 United Kingdom
- 5.4.2.3 France
- 5.4.2.4 Italy
- 5.4.2.5 Spain
- 5.4.2.6 Rest of Europe
- 5.4.3 Asia-Pacific
- 5.4.3.1 China
- 5.4.3.2 India
- 5.4.3.3 Japan
- 5.4.3.4 Australia
- 5.4.3.5 South Korea
- 5.4.3.6 Rest of Asia-Pacific
- 5.4.4 Middle East and Africa
- 5.4.4.1 GCC
- 5.4.4.2 South Africa
- 5.4.4.3 Rest of Middle East and Africa
- 5.4.5 South America
- 5.4.5.1 Brazil
- 5.4.5.2 Argentina
- 5.4.5.3 Rest of South America
- 5.4.1 North America
6 Competitive Landscape
- 6.1 Market Concentration
- 6.2 Market Share Analysis
- 6.3 Company Profiles (includes Global level Overview, Market level overview, Core Segments, Financials as available, Strategic Information, Market Rank/Share for key companies, Products & Services, and Recent Developments)
- 6.3.1 ACG Worldwide
- 6.3.2 Colanar AG
- 6.3.3 Danaher (Cytiva & Pall)
- 6.3.4 Esco Lifesciences
- 6.3.5 GEA Group AG
- 6.3.6 IMA Group
- 6.3.7 Korber Pharma
- 6.3.8 Merck KGaA (MilliporeSigma)
- 6.3.9 Optima Packaging
- 6.3.10 Pall Corporation
- 6.3.11 Romaco Group
- 6.3.12 Sartorius AG
- 6.3.13 Shinva Medical
- 6.3.14 Stevanato Group
- 6.3.15 Syntegon Technology
- 6.3.16 Thermo Fisher Scientific
- 6.3.17 Tofflon Science & Technology
- 6.3.18 Truking Technology
7 Market Opportunities & Future Outlook
- 7.1 White-space & Unmet-Need Assessment

