
PUBLISHER: Mordor Intelligence | PRODUCT CODE: 2043963

PUBLISHER: Mordor Intelligence | PRODUCT CODE: 2043963
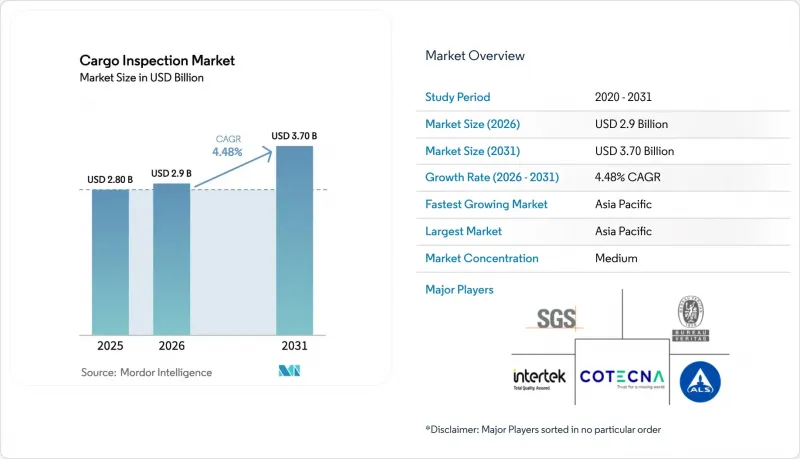
Cargo Inspection - Market Share Analysis, Industry Trends & Statistics, Growth Forecasts (2026 - 2031)
The Cargo Inspection Market size is projected to be USD 2.80 billion in 2025, USD 2.9 billion in 2026, and reach USD 3.70 billion by 2031, growing at a CAGR of 4.48% from 2026 to 2031.
Regulatory tightening is a clear growth catalyst as customs programs formalize requirements for ethical conduct, AEO coverage for smaller traders, and earlier risk interventions in the supply chain. Operational modernization is underway within major inspection providers, with digital workflows and remote operations allowing faster turnarounds and better transparency for public-sector contracts. Port expansions in the Middle East and South Asia elevate throughput expectations and increase touchpoints for quality, quantity, and safety checks. Rising parcelization from cross-border e-commerce pushes customs to strengthen data quality, small-parcel screening, and non-intrusive inspection deployment. Execution gaps remain as scanning targets and digitalization milestones run into capital constraints, site readiness issues, and staffing shortfalls, which sustain demand for third-party inspection and risk analytics services.
Global Cargo Inspection Market Trends and Insights
Stringent Regulatory Requirements and Customs Compliance
The World Customs Organization's 2025 SAFE Framework update widened AEO eligibility to micro, small, and medium-sized enterprises and introduced mandatory ethics codes, anchoring stronger governance for certified traders and greater vigilance against insider threats. U.S. policy momentum points to much higher scan rates at land borders, although fiscal year 2024 performance lagged with 8% scanning of passenger vehicles and 27% for commercial vehicles, which keeps the door open for expanded third-party inspection support and technology rollouts. The U.S. plan to deploy 38 additional non-intrusive inspection systems in fiscal year 2026 targets stronger coverage on the southwest border, with interim targets of 40% for privately owned vehicles and 70% for commercial trucks that will raise inspection workloads. Europe's customs reform removes the EUR 150 duty exemption and places more responsibility on e-commerce platforms, while audits show a high share of undervaluation and non-compliance within low-value consignments, signaling a larger role for upstream verification and data-quality assurance. Tightening across regions increases the value of certified inspection partnerships, automated documentation, and pre-loading verification, especially for categories with higher fraud or safety risks. Accreditation ecosystems, such as ISO and national accreditation bodies, shape how inspection protocols are validated and recognized across jurisdictions, with a shift toward real-time data exchange.
Technological Advancements in Non-Intrusive Inspection Systems
Customs modernization programs highlight AI, IoT, and machine learning as core tools that improve image analytics, risk scoring, and cargo tracking, which lifts detection rates without slowing clearance of compliant shipments. Country cases supported by the WCO showcase deployments of AI-driven risk management and scanner interoperability, while similar efforts along the U.S. southwest border focus on training algorithms to flag anomalies for officer review. Procurement momentum continues as governments invest in high-energy mobile cargo inspection systems and complementary screening units for ports and border crossings, strengthening mobile coverage where construction or site constraints limit fixed installations. These projects require careful calibration and site integration to avoid interference with other detection assets, which has driven cost overruns and schedule slips in complex, high-traffic environments. Adoption remains uneven across customs administrations due to budget limits, construction lead times, and systems engineering demands, which creates a bifurcated landscape of AI-augmented inspection services and legacy X-ray equipment. Interoperability with evolving technical standards, including those issued by international or regional bodies, increases in importance as authorities coordinate data flows and align operating procedures.
High Capital Investment and Implementation Costs
Large-scale non-intrusive inspection installations face construction, space, and systems-integration hurdles that extend schedules and increase costs, which slow scan-rate improvements against statutory targets. U.S. deployments illustrate these realities, with fiscal year 2024 scan rates reaching only 8% for passenger vehicles and 27% for commercial vehicles as site constraints and interference with other systems delayed progress. At ports, terminal expansions that integrate automation, electrification, and deep-water berths require significant capital, which intensifies pressure on operators to recover costs through higher throughput and operational efficiencies. New maritime safety rules add survey and certification requirements that drive recurring compliance spending for shipowners, expanding demand for inspection and verification but also elevating lifecycle costs across fleets. Emerging markets often turn to phased procurement or PPP structures to spread out investment, which can defer full capability while complicating vendor management and performance oversight. Inspection providers that offer flexible commercial models and modular deployments are better placed to align with constrained budgets and evolving site-readiness conditions.
Other drivers and restraints analyzed in the detailed report include:
- Infrastructure Development in Emerging Markets
- Increasing Global Trade Volumes and Cross-Border Commerce
- Operational Complexity and Technical Expertise Requirements
For complete list of drivers and restraints, kindly check the Table Of Contents.
Segment Analysis
Oil and gas held 43.13% of the cargo inspection market share in 2025, reflecting a long-standing reliance on quality and quantity certification for bulk hydrocarbon shipments, while chemicals and fertilizers are projected to post the fastest growth at 7.43% through 2031 as purity standards and traceability mandates tighten. Demand for biofuel, marine fuel, and sustainable aviation fuel testing is rising in step with refinery and blending activity, and suppliers are expanding analytical capacity to address new feedstocks and lower-carbon product specifications. The International Fertilizer Association's Product Stewardship framework broadened scope across the product lifecycle, which deepens the inspection footprint from production to storage and distribution, and third-party audits continue to benchmark facilities against high-performance thresholds. Metals and minerals inspection remains a steady line of business as copper and gold activity supports laboratory services and onsite testing, with targeted acquisitions used to add geochemical depth and local reach. Agriculture commodities inspection benefits from grain quality standards, defined procedures, and fee structures that sustain verification demand even when shipment volumes vary by season. Consumer goods inspection is being shaped by new e-filing requirements and stronger data exchange rules, which push more compliance steps upstream and reinforce demand for pre-loading verification and documentation integrity.
From 2019-2025, oil and gas dominated the cargo inspection market, but the chemicals and fertilizers segment accelerated as sustainability expectations, stewardship standards, and lifecycle documentation needs expanded. The cargo inspection industry is responding with bundled offerings that combine testing, certification, and remote audits to manage cost and timing pressures while preserving assurance levels expected by lenders and buyers. Upstream services in metals and minerals maintained momentum through mining capital spending cycles and exploration activity, which reinforced demand for geochemical analysis and onsite labs. In agriculture, standardized inspection rates and consistent quality criteria helped stabilize service demand even as exporters adapted to route adjustments and weather variations. For consumer goods, digital certificate filing and platform-based data exchange are reshaping the points at which inspection, verification, and documentation happen, driving earlier interventions to avoid border delays. Incumbents are defending margins with digital workflow tools and acquisition-led expansions that add laboratory scale in growth corridors and build resilience into global networks.
The Cargo Inspection Market Report is Segmented by Cargo Type (Oil & Gas, Metals & Minerals, and More), by Service Type (Quality & Quantity Verification, Weight & Draft Survey, Damage & Contamination Inspection, Pre-shipment/Pre-loading Inspection, Others), and by Geography (North America, South America, Asia-Pacific, Europe, Middle East and Africa). Market Forecasts are Provided in Value (USD).
Geography Analysis
Asia-Pacific held 30.76% of the 2025 cargo inspection market share and is set to record the fastest regional growth at 7.81% through 2031, supported by terminal upgrades, customs digitization, and e-commerce parcel surges. India's Sagarmala projects added handling capacity at scale and cut average vessel turnaround time to 49.47 hours, while ongoing connectivity works continue to align landside links with new terminal capacity. East of the Arabian Peninsula, the Jeddah terminal expansion more than doubled throughput and added a high-capacity reefer inspection facility, which improves perishable flow while raising service-level expectations for verification and documentation. Jebel Ali's expansion of electric terminal vehicles and electric handlers shows a move toward lower emissions operations, and related efficiencies create scope for further digital investment. These projects concentrate cargo flows in large hubs, which elevates throughput planning needs for inspection teams and reinforces the value of structured access agreements at busy gateways. Region-wide, customs and port authorities are expanding technology use and training, which promotes interoperability between inspection systems and supply-chain data platforms.
North America is moving to lift scan coverage at land borders through additional non-intrusive inspection deployments in fiscal year 2026, which will generate more inspection events and associated service demand as systems come online. Oversight reviews have flagged construction challenges and space constraints at high-traffic crossings, which implies a staggered ramp as sites are readied and interference risks are managed. Federal procurement, such as vessel observation for food aid, shows continued use of third-party assurance to manage program quality and integrity. Within the private sector, consolidation and capability expansions are notable, including acquisitions focused on specialized testing, calibration, and forensics that complement inspection and verification work. Consumer product rules are adding e-filing requirements that will affect data and certificate workflows, raising the importance of software modules that tie together product compliance and customs entry. Together, these actions show a path to a more automated and data-anchored clearance environment that expands the role of inspection partners in planning and execution.
Europe is preparing for a phased customs reform that removes the EUR 150 de minimis threshold and shifts more responsibility to platforms, which will push more verification steps upstream and emphasize clean data capture. The central EU Customs Data Hub is positioned to centralize and harmonize submissions, which creates opportunities for inspection providers that can integrate test results, certificates, and supporting records into standardized formats. Maritime rules on lifting appliances and fuel-oil sampling update equipment certification and sampling requirements, which reinforce shipboard verification and lab support. Across Europe, AEO programs and national accreditation standards continue to set the stage for recognition of inspection protocols and lab competence. The success of EU reforms will depend on smooth integration with customs IT and e-commerce platforms, which could influence dwell time and inspection scheduling in the near term. Over the forecast, structural reforms and steady technology adoption support consistent demand for inspection across high-value goods and compliance-sensitive categories.
- SGS SA
- Bureau Veritas SA
- Intertek Group plc
- Cotecna Inspection SA
- ALS Limited
- Eurofins Scientific
- TUV SUD
- TUV Rheinland
- Dekra SE
- DNV AS
- CCIC (China Certification & Inspection (Group))
- Core Laboratories (Saybolt)
- Peterson & Control Union
- Applus+
- AIM Control Group
- Q&Q Control Services
- Marine Inspection LLC
- Alex Stewart International (ASI)
- OMIC USA
- Camin Cargo Control
Additional Benefits:
- The market estimate (ME) sheet in Excel format
- 3 months of analyst support
TABLE OF CONTENTS
1 Introduction
- 1.1 Study Assumptions & Market Definition
- 1.2 Scope of the Study
2 Research Methodology
3 Executive Summary
4 Market Landscape
- 4.1 Market Overview
- 4.2 Market Drivers
- 4.2.1 Increasing Global Trade Volumes and Cross-Border Commerce
- 4.2.2 Stringent Regulatory Requirements and Customs Compliance
- 4.2.3 Rising Security Threats and Contraband Smuggling Concerns
- 4.2.4 Technological Advancements in Non-Intrusive Inspection (NII) Systems
- 4.2.5 E-commerce Boom and Small Parcel Inspection Demands
- 4.2.6 Infrastructure Development in Emerging Markets
- 4.3 Market Restraints
- 4.3.1 High Capital Investment and Implementation Costs
- 4.3.2 Operational Complexity and Technical Expertise Requirements
- 4.3.3 Privacy Concerns and Data Security Issues
- 4.3.4 Maintenance Challenges and Lifecycle Costs
- 4.4 Value / Supply-Chain Analysis
- 4.5 Regulatory Landscape
- 4.6 Technological Outlook
- 4.7 Porter's Five Forces
- 4.7.1 Threat of New Entrants
- 4.7.2 Bargaining Power of Suppliers
- 4.7.3 Bargaining Power of Buyers
- 4.7.4 Threat of Substitutes
- 4.7.5 Competitive Rivalry
- 4.8 Mobile and Modular Inspection Solutions Gaining Traction
- 4.9 Public-Private Partnerships Driving Market Innovation
5 Market Size & Growth Forecasts (Value, 2020-2031)
- 5.1 By Cargo Type
- 5.1.1 Oil & Gas
- 5.1.2 Metals & Minerals
- 5.1.3 Agriculture Commodities
- 5.1.4 Chemicals & Fertilizers
- 5.1.5 Consumer Goods
- 5.1.6 Others
- 5.2 By Service Type
- 5.2.1 Quality & Quantity Verification
- 5.2.2 Weight & Draft Survey
- 5.2.3 Damage & Contamination Inspection
- 5.2.4 Pre-shipment/Pre-loading Inspection
- 5.2.5 Bunker Quantity & Fuel Quality Survey
- 5.2.6 Loading/Unloading Supervision
- 5.2.7 Others
- 5.3 By Geography
- 5.3.1 North America
- 5.3.1.1 United States
- 5.3.1.2 Canada
- 5.3.1.3 Mexico
- 5.3.2 South America
- 5.3.2.1 Brazil
- 5.3.2.2 Peru
- 5.3.2.3 Chile
- 5.3.2.4 Argentina
- 5.3.2.5 Rest of South America
- 5.3.3 Asia-Pacific
- 5.3.3.1 India
- 5.3.3.2 China
- 5.3.3.3 Japan
- 5.3.3.4 Australia
- 5.3.3.5 South Korea
- 5.3.3.6 South East Asia
- 5.3.3.7 Rest of Asia-Pacific
- 5.3.4 Europe
- 5.3.4.1 United Kingdom
- 5.3.4.2 Germany
- 5.3.4.3 France
- 5.3.4.4 Spain
- 5.3.4.5 Italy
- 5.3.4.6 BENELUX (Belgium, Netherlands, and Luxembourg)
- 5.3.4.7 NORDICS (Denmark, Finland, Iceland, Norway, and Sweden)
- 5.3.4.8 Rest of Europe
- 5.3.5 Middle East and Africa
- 5.3.5.1 United Arab of Emirates
- 5.3.5.2 Saudi Arabia
- 5.3.5.3 South Africa
- 5.3.5.4 Nigeria
- 5.3.5.5 Rest of Middle East And Africa
- 5.3.1 North America
6 Competitive Landscape
- 6.1 Market Concentration
- 6.2 Strategic Moves
- 6.3 Market Share Analysis
- 6.4 Company Profiles (includes Global level Overview, Market level overview, Core Segments, Financials as available, Strategic Information, Market Rank/Share for key companies, Products & Services, and Recent Developments)
- 6.4.1 SGS SA
- 6.4.2 Bureau Veritas SA
- 6.4.3 Intertek Group plc
- 6.4.4 Cotecna Inspection SA
- 6.4.5 ALS Limited
- 6.4.6 Eurofins Scientific
- 6.4.7 TUV SUD
- 6.4.8 TUV Rheinland
- 6.4.9 Dekra SE
- 6.4.10 DNV AS
- 6.4.11 CCIC (China Certification & Inspection (Group))
- 6.4.12 Core Laboratories (Saybolt)
- 6.4.13 Peterson & Control Union
- 6.4.14 Applus+
- 6.4.15 AIM Control Group
- 6.4.16 Q&Q Control Services
- 6.4.17 Marine Inspection LLC
- 6.4.18 Alex Stewart International (ASI)
- 6.4.19 OMIC USA
- 6.4.20 Camin Cargo Control
7 Market Opportunities & Future Outlook

