
PUBLISHER: Mordor Intelligence | PRODUCT CODE: 2043974

PUBLISHER: Mordor Intelligence | PRODUCT CODE: 2043974
Immersive Entertainment - Market Share Analysis, Industry Trends & Statistics, Growth Forecasts (2026 - 2031)
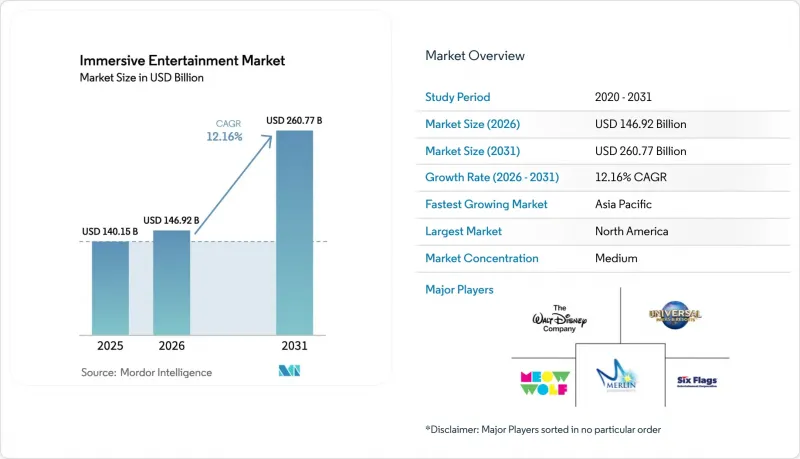
The immersive entertainment market size is expected to increase from USD 140.15 billion in 2025 to USD 146.92 billion in 2026 and reach USD 260.77 billion by 2031, growing at a CAGR of 12.16% over 2026-2031. Pent-up demand for shared, out-of-home experiences, multi-billion-dollar venue reinvestment, and AI-driven pricing engines are raising average guest spend while smoothing revenue volatility. Capital flows are accelerating, with experiential real-estate investment trusts underwriting venue build-outs and reducing operators' cost of capital. Concurrently, 5G-enabled mixed-reality overlays and affordable haptic hardware are refreshing aging attractions at far lower cost than ground-up construction. These shifts allow operators to capture larger consumer-wallet share even as traditional theme-park attendance plateaus in mature regions.
Global Immersive Entertainment Market Trends and Insights
Explosive Theme-Park CAPEX Pipelines Drive Market Expansion
Operators are pouring record sums into new lands, ride systems, and hospitality assets to defend pricing power and lengthen guest stays. The Walt Disney Company earmarked USD 60 billion for parks and experiences through 2034, eclipsing its streaming budget. Universal is debuting the USD 5 billion Epic Universe resort in Orlando in May 2025, adding 750 acres and several proprietary IP zones. Merged Six Flags-Cedar Fair now manages 42 parks, unlocking procurement synergies and cross-park season-pass reciprocity. High CAPEX creates a moat because smaller rivals lack the balance-sheet strength to match multi-sensory fidelity, enabling tier-one operators to justify 40-60% ticket premiums.
Post-COVID "Experience over Things" Consumer Shift
Global household budget allocations continue to tilt toward live experiences over material goods, with Gen Z and millennials prioritizing social-media-worthy outings. Operators design attractions around shareable moments-such as Meow Wolf's kaleidoscopic rooms-cutting customer-acquisition costs by an estimated 30-40% versus paid digital advertising. Social commerce further amplifies reach; user-generated content from teamLab's Tokyo exhibitions accounts for roughly half of annual ticket sales. Consequently, even discretionary spending slowdowns have had a muted impact on visit frequency.
Rising Insurance and Safety-Compliance Costs
Premiums for interactive attractions jumped 15-20% in 2024-2025 after a spate of incidents prompted tighter underwriting. Deductibles for VR venues climbed to USD 50,000-75,000, while adherence to ASTM F24 and ISO 17025 standards adds up to USD 250,000 annually in inspection and remediation costs. Smaller operators face disproportionate burden, as fixed compliance expenses consume 8-12% of revenue versus 2-3% for large chains with dedicated safety teams. The strategic response: operators are consolidating or exiting, ceding market share to well-capitalized players who can absorb regulatory overhead.
Other drivers and restraints analyzed in the detailed report include:
- Fast-Maturing Location-Based VR Business Models
- 5G and Edge Computing Enable Real-Time Multi-User AR Overlays
- Content-Licensing Fatigue among IP Right-Holders
For complete list of drivers and restraints, kindly check the Table Of Contents.
Segment Analysis
Themed entertainment captured 40.83% of 2025 application revenue, reflecting decades of installed ride capacity and multi-generational brand loyalty. Live immersive gaming events, however, are projected to log the fastest 12.20% CAGR as esports arenas integrate VR battle zones that monetize both competitors and spectators, extending the immersive entertainment market size for event-focused venues. Haunted attractions and escape rooms remain attractive for investors because a single site can open for USD 0.2-0.5 million yet deliver paybacks within two peak seasons.
Repeat visitation is becoming a key metric. VR esports lounges piloted by Dave and Buster's delivered 35% longer dwell times and USD 18-22 incremental food-and-beverage spend per visit. Immersive theaters such as Punchdrunk's Sleep No More command premium price points but scale slowly because each production requires bespoke casts and venues. Experiential art museums, led by teamLab, generate high margins once installations are amortized, proving that aesthetic novelty can rival narrative IP in expanding the immersive entertainment market.
Virtual reality accounted for 31.73% of 2025 technology spend, boosted by sub-USD 500 headsets and evergreen content libraries. Haptics and multisensory rigs are forecast to rise at 12.23% CAGR, leveraging motion seats, tactile vests, and scent cannons to justify premium ticket tiers and defend the immersive entertainment market share of premium experiences. Augmented reality adoption lags due to battery life and device fragmentation, yet mixed-reality hybrids such as Mario Kart: Bowser's Challenge prove that practical sets fused with AR can sustain hour-plus queue times.
Disney's Guardians of the Galaxy, Cosmic Rewind integrates programmable motion seats delivering 12 degrees of freedom, commanding USD 20-30 upcharges for enhanced rides. Suppliers including D-BOX Technologies report 40-50% order growth from operators combating at-home VR commoditization. Such upgrades solidify "you-must-be-there" differentiation and expand the immersive entertainment market size for haptic-rich attractions.
The Immersive Entertainment Market Report is Segmented by Application (Themed Entertainment, Haunted Attractions and Escape Rooms, and More), Technology (Virtual Reality, Augmented Reality, and More), Venue Type (Theme and Amusement Parks, Family/Indoor Entertainment Centers, and More), Revenue Stream (Ticket Sales, Food and Beverage, and More), and Geography. The Market Forecasts are Provided in Terms of Value (USD).
Geography Analysis
North America retained 44.52% of 2025 global revenue, anchored by Florida's and California's dense theme-park ecosystems that pulled roughly 90 million visits last year. High disposable income supports an average daily per-capita spend of USD 100-plus, while AI-driven pricing platforms such as Disney's Genie+ lifted per-guest revenue by USD 8-12. Market saturation is prompting operators to invest in premium add-ons rather than raw capacity, sustaining the immersive entertainment market despite plateauing attendance.
Asia-Pacific is the fastest-growing region, with a projected 12.39% CAGR, propelled by China's cultural tourism mandates and Japan's leadership in projection-mapping artistry. Saudi Arabia's USD 8 billion Qiddiya complex exemplifies how Gulf giga-projects are importing best-in-class operators to leapfrog regional competition. Southeast Asia's middle class is crossing discretionary-income thresholds that historically trigger accelerated adoption in the immersive entertainment market.
Europe accounted for roughly one-quarter of revenue in 2025 but is constrained by shorter operating seasons and lower per-visitor spend. Yet the continent is home to artistic projection venues such as Atelier des Lumieres, illustrating that cultural heritage fused with digital art can sustain demand outside peak summer months. The Middle East and Africa segment, while small, benefits from sovereign funding backing large-scale integrated resorts, progressively lifting the immersive entertainment market share of the region.
List of Companies Covered in this Report:
- teamLab Inc.
- Meow Wolf, LLC
- Secret Cinema Limited
- Culturespaces SAS
- Museum of Ice Cream, Inc.
- Grande Experiences Pty Ltd.
- The Walt Disney Company
- Universal Parks and Resorts (Comcast Corp.)
- Six Flags Entertainment Corp.
- Cedar Fair Entertainment Company
- Merlin Entertainments Limited
- SeaWorld Entertainment, Inc.
- Parques Reunidos Servicios Centrales S.A.
- Moment Factory Inc.
- Punchdrunk Global Limited
- Illuminarium Experiences LLC
- Superblue Miami LLC
- Sandbox VR, Inc.
- Holovis International Limited
- Framestore Limited
- Felix and Paul Studios Inc.
- Darkfield Radio Limited
- The VOID, LLC
- Coastiality (Mack International GmbH)
- Dave and Buster's Entertainment, Inc.
- Framestore Ltd.
Additional Benefits:
- The market estimate (ME) sheet in Excel format
- 3 months of analyst support
TABLE OF CONTENTS
1 INTRODUCTION
- 1.1 Study Assumptions and Market Definition
- 1.2 Scope of the Study
2 RESEARCH METHODOLOGY
3 EXECUTIVE SUMMARY
4 MARKET LANDSCAPE
- 4.1 Market Overview
- 4.2 Market Drivers
- 4.2.1 Explosive Theme-Park CAPEX Pipelines
- 4.2.2 Post-COVID "Experience over Things" Consumer Shift
- 4.2.3 Fast-Maturing Location-Based VR Business Models
- 4.2.4 5G and Edge Enabling Real-Time Multi-User AR Overlays
- 4.2.5 Experiential Real-Estate REITs Unlocking New Capital Pools
- 4.2.6 AI-Driven Dynamic Ticket Pricing Boosting Per-Cap Spend
- 4.3 Market Restraints
- 4.3.1 Rising Insurance and Safety-Compliance Costs
- 4.3.2 Content-Licensing Fatigue among IP Right-Holders
- 4.3.3 High Staff Turnover in Live Interactive Attractions
- 4.3.4 Local-Community Backlash over "Immersive Fatigue"
- 4.4 Value Chain Analysis
- 4.5 Regulatory Landscape
- 4.6 Impact of Macroeconomic Factors on the Market
- 4.7 Porter's Five Forces Analysis
- 4.7.1 Bargaining Power of Suppliers
- 4.7.2 Bargaining Power of Buyers
- 4.7.3 Threat of New Entrants
- 4.7.4 Threat of Substitutes
- 4.7.5 Competitive Rivalry
5 MARKET SIZE and GROWTH FORECASTS (VALUE)
- 5.1 By Application
- 5.1.1 Themed Entertainment
- 5.1.2 Haunted Attractions and Escape Rooms
- 5.1.3 Immersive Theatres
- 5.1.4 Experiential Art Museums
- 5.1.5 Exhibitions and Retail Installations
- 5.1.6 Live Immersive Gaming Events
- 5.2 By Technology
- 5.2.1 Virtual Reality (VR)
- 5.2.2 Augmented Reality (AR)
- 5.2.3 3D Audio and Spatial Sound
- 5.2.4 Mixed Reality (MR)
- 5.2.5 Haptics and Multisensory Tech
- 5.3 By Venue Type
- 5.3.1 Theme and Amusement Parks
- 5.3.2 Family/Indoor Entertainment Centers
- 5.3.3 Museums and Galleries
- 5.3.4 Stand-Alone Immersive Venues
- 5.3.5 Pop-Up and Temporary Installations
- 5.4 By Revenue Stream
- 5.4.1 Ticket Sales
- 5.4.2 Food and Beverage
- 5.4.3 Merchandise
- 5.4.4 Sponsorship and Brand Partnerships
- 5.4.5 IP Licensing and Royalties
- 5.4.6 Subscription and Memberships
- 5.5 By Geography
- 5.5.1 North America
- 5.5.1.1 United States
- 5.5.1.2 Canada
- 5.5.1.3 Mexico
- 5.5.2 South America
- 5.5.2.1 Brazil
- 5.5.2.2 Argentina
- 5.5.2.3 Rest of South America
- 5.5.3 Europe
- 5.5.3.1 Germany
- 5.5.3.2 United Kingdom
- 5.5.3.3 France
- 5.5.3.4 Italy
- 5.5.3.5 Spain
- 5.5.3.6 Rest of Europe
- 5.5.4 Asia-Pacific
- 5.5.4.1 China
- 5.5.4.2 Japan
- 5.5.4.3 India
- 5.5.4.4 South Korea
- 5.5.4.5 ASEAN
- 5.5.4.6 Rest of Asia-Pacific
- 5.5.5 Middle East
- 5.5.5.1 Saudi Arabia
- 5.5.5.2 United Arab Emirates
- 5.5.5.3 Rest of Middle East
- 5.5.6 Africa
- 5.5.6.1 South Africa
- 5.5.6.2 Nigeria
- 5.5.6.3 Egypt
- 5.5.6.4 Rest of Africa
- 5.5.1 North America
6 COMPETITIVE LANDSCAPE
- 6.1 Market Concentration
- 6.2 Strategic Moves
- 6.3 Market Share Analysis
- 6.4 Company Profiles (includes Global Level Overview, Market Level Overview, Core Segments, Financials as available, Strategic Information, Market Rank/Share, Products and Services, Recent Developments)
- 6.4.1 teamLab Inc.
- 6.4.2 Meow Wolf, LLC
- 6.4.3 Secret Cinema Limited
- 6.4.4 Culturespaces SAS
- 6.4.5 Museum of Ice Cream, Inc.
- 6.4.6 Grande Experiences Pty Ltd.
- 6.4.7 The Walt Disney Company
- 6.4.8 Universal Parks and Resorts (Comcast Corp.)
- 6.4.9 Six Flags Entertainment Corp.
- 6.4.10 Cedar Fair Entertainment Company
- 6.4.11 Merlin Entertainments Limited
- 6.4.12 SeaWorld Entertainment, Inc.
- 6.4.13 Parques Reunidos Servicios Centrales S.A.
- 6.4.14 Moment Factory Inc.
- 6.4.15 Punchdrunk Global Limited
- 6.4.16 Illuminarium Experiences LLC
- 6.4.17 Superblue Miami LLC
- 6.4.18 Sandbox VR, Inc.
- 6.4.19 Holovis International Limited
- 6.4.20 Framestore Limited
- 6.4.21 Felix and Paul Studios Inc.
- 6.4.22 Darkfield Radio Limited
- 6.4.23 The VOID, LLC
- 6.4.24 Coastiality (Mack International GmbH)
- 6.4.25 Dave and Buster's Entertainment, Inc.
- 6.4.26 Framestore Ltd.
7 MARKET OPPORTUNITIES and FUTURE OUTLOOK
- 7.1 White-Space and Unmet-Need Assessment

