
PUBLISHER: Mordor Intelligence | PRODUCT CODE: 2044030

PUBLISHER: Mordor Intelligence | PRODUCT CODE: 2044030
Telco Mobile Money - Market Share Analysis, Industry Trends & Statistics, Growth Forecasts (2026 - 2031)
The Telco Mobile Money Market size is projected to be USD 17.5 billion in 2025, USD 20.40 billion in 2026, and reach USD 43.5 billion by 2031, growing at a CAGR of 16.40% from 2026 to 2031.
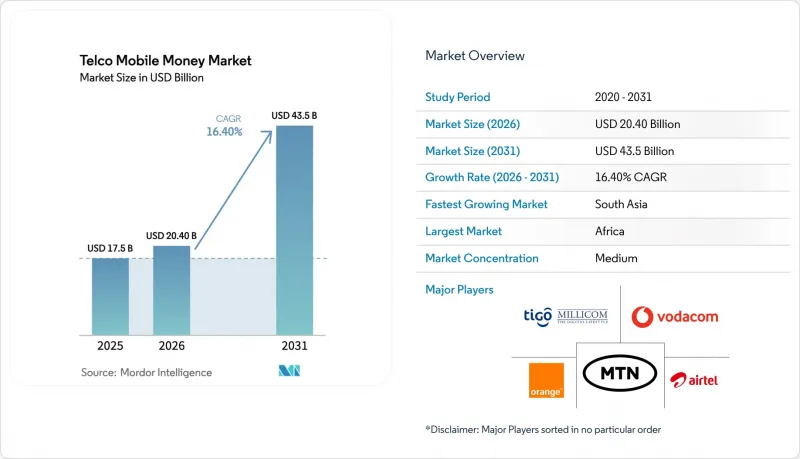
Momentum reflects the shift from voice-centric telecom economics toward data-anchored financial services, with mobile network operators now operating as quasi-banks in underserved economies. Sub-Saharan Africa generated 58.6% of global revenue in 2025, yet South Asia is projected to record the fastest expansion as regulatory reforms in India and Pakistan lower entry barriers for non-bank issuers and urban smartphone penetration tops 60%. Merchant payments, a comparatively smaller use case in 2025, are accelerating as fast-moving consumer goods suppliers and utilities embed QR code acceptance, while cross-border wallet corridors capture remittance flows that once relied on informal networks. Competitive intensity is rising because BigTech super-apps and standalone fintech unicorns are squeezing take rates, which is pushing incumbent telcos to monetize application-programming interfaces, issue nano-loans, and bundle insurance.
Global Telco Mobile Money Market Trends and Insights
Smartphone Penetration And QR Rails Expanding Acceptance
Smartphone adoption surpassed 50% in many frontier economies during 2025, catalyzing a wave of QR-enabled merchant acceptance that sidesteps traditional point-of-sale hardware. Kenya expanded from 320,000 QR merchants in January 2025 to 510,000 by year-end, with average ticket sizes 18% higher than USSD payments due to reduced friction. Nigeria mandated QR interoperability in October 2024, and transaction volumes doubled to 420 million during 2025. Low-cost Android handsets, 62% of which retailed for less than USD 80 in Africa, lowered the entry barrier to digital wallets. Richer metadata from app and QR channels is enabling telcos to roll out dynamic discounting and targeted advertising, contributing an estimated 9% of mobile-money gross profit in Kenya and Tanzania during 2025.
Regulatory Enablement Of E-Money And Agent Banking
Progressive rules are legitimizing non-bank issuance of stored value and the use of third-party agents. Pakistan revised its branchless banking directives in March 2024, allowing telcos to register agents directly; the network reached 580,000 outlets by 2025, up 38% year-on-year. Ethiopia licensed Ethio Telecom's Telebirr in May 2024, and the wallet attracted 35 million subscribers and processed USD 4.2 billion by December 2025. India allowed payment aggregators to extend wallet-based credit in September 2024, prompting JioMoney to disburse USD 620 million in nano-loans during 2025. Such frameworks convert telcos from remittance rails into full-fledged financial services distributors, enabling them to enter into revenue-sharing deals with legacy banks for deposits and lending.
Interchange Caps And E-Levies Compress Unit Economics
Fiscal pressures have prompted several governments to tax wallet transactions. Uganda's 0.5% withdrawal levy, introduced in July 2024, drove an 8.2% decline in monthly volumes during the first quarter of 2025. Zimbabwe's 2% transfer tax dragged down the 2025 transaction value by 14% compared with 2024. Ghana's 1% levy cut market growth to 6% in 2025 from a pre-tax trend of 22%. These charges dent low-value usage, forcing operators to lobby for exemptions and to subsidize merchant payments.
Other drivers and restraints analyzed in the detailed report include:
- Merchant Payment Digitization By FMCG And Utilities
- Cross-Border Corridors Integrating With Mobile Money
- De-Risking And Correspondent Bank Friction On Cross-Border
For complete list of drivers and restraints, kindly check the Table Of Contents.
Segment Analysis
P2P transfers retained 42.24% of the telco mobile money market share in 2025, underscoring the channel's role in remittance flows. Merchant payments, however, are projected to grow at 19.4% annually, driven by the adoption of QR codes and real-time settlement incentives. Bill payments grew 14.8% as governments pushed digital fee collection. Cash-in and cash-out transactions remain pivotal to liquidity but now face lower fees following the April 2025 Kenyan cap, prompting operators to nudge users toward wallet-to-wallet flows.
International remittances via wallets reached USD 3.7 billion in 2025, up 20.3% year over year. Savings products attracted USD 1.2 billion in deposits despite the ambiguity around deposit insurance. Credit and nano-loans totaled USD 4.8 billion with default rates near 3.2%. Insurance enrollment reached 18 million users, centered on health and crop coverages, yet opaque claims reporting limits transparency.
The Telco Mobile Money Market Report is Segmented by Use Case (P2P Transfers, Merchant Payments, Bill Payments, and More), Transaction Corridor (Domestic and Cross-Border), Access Channel (USSD/STK, App/QR/NFC, Agent POS/Feature Phone), and Geography. The Market Forecasts are Provided in Terms of Value (USD).
Geography Analysis
Africa accounted for a 58.6% share of the telco mobile money market in 2025, anchored by Kenya, Nigeria, Ghana, Tanzania, and Uganda, where wallet penetration among adults exceeds 70%. Kenya processed USD 98 billion, 87% of GDP, with M-PESA holding 68% of the telco mobile money market share. Nigeria recorded USD 42 billion in exports, up 28% amid a cashless push and ISO-20022 instant transfers. Ethiopia's Telebirr scaled to 35 million users and USD 4.2 billion in value within 18 months, the fastest adoption globally. Fiscal headwinds include Uganda's withdrawal levy and Ghana's electronic transfer tax, both of which are dampening transaction frequency.
South Asia is projected to grow at 19.1% annually through 2031, driven by deregulation and rapid smartphone adoption. Pakistan's JazzCash and Easypaisa moved PKR 38 trillion (USD 136 billion) in 2025 under agent-licensing reforms. India's 420 million wallet users face moderated growth because the Unified Payments Interface dominates 131 billion transactions, dwarfing wallet volumes. Bangladesh's bKash and Nagad processed BDT 78 trillion (USD 710 billion) in 2025 after an October 2024 interoperability mandate.
Southeast Asia and the Middle East add strategic reach. Globe Telecom's GCash hit 92 million users and USD 28 billion in value in 2025, morphing into a super-app. TrueMoney moved USD 14 billion across Thailand, Cambodia, Myanmar, and Vietnam. Gulf operators such as Saudi Arabia's stc pay (6.2 million active users) benefit from instant rails, whereas UAE wallets struggle against near-universal banking. Regulatory fragmentation, exemplified by Qatar's Ooredoo Mobile Money and Iraq's Zain Cash, still complicates regional scale.
- Vodacom Group Limited
- MTN Group Limited
- Orange S.A.
- Bharti Airtel Limited
- Millicom International Cellular S.A.
- Safaricom PLC
- Viettel Military Industry and Telecoms Group
- Jazz (Pakistan Mobile Communications Limited (PMCL))
- Globe Telecom, Inc.
- Ethio Telecom
- Etisalat (Emirates Telecommunications Group Company PJSC)
Additional Benefits:
- The market estimate (ME) sheet in Excel format
- 3 months of analyst support
TABLE OF CONTENTS
1 INTRODUCTION
- 1.1 Study Assumptions and Market Definition
- 1.2 Scope of the Study
2 RESEARCH METHODOLOGY
3 EXECUTIVE SUMMARY
4 MARKET LANDSCAPE
- 4.1 Market Overview
- 4.2 Market Drivers
- 4.2.1 Smartphone Penetration and QR Rails Expanding Acceptance
- 4.2.2 Regulatory Enablement of E-money and Agent Banking
- 4.2.3 Merchant Payment Digitization by FMCG and Utilities
- 4.2.4 Cross-Border Corridors Integrating with Mobile Money
- 4.2.5 API Monetization with Fintech/Platform Partners
- 4.2.6 Government Disbursements and Wage Digitization
- 4.3 Market Restraints
- 4.3.1 Interchange Caps and E-levies Compress Unit Economics
- 4.3.2 De-Risking and Correspondent Bank Friction on Cross-Border
- 4.3.3 SIM/USSD Security Exploits and Fraud Losses
- 4.3.4 Cash-Out Dependency Limiting Float Velocity
- 4.4 Industry Value Chain Analysis
- 4.5 Industry Ecosystem Analysis [MNO, super-agents, aggregators, banks (as partners), regulators, merchants, remittance partners]
- 4.6 Regulatory Landscape
- 4.7 Technological Outlook (USSD/STK, App, QR, Interoperability, APIs)
- 4.8 Porter's Five Forces Analysis
- 4.8.1 Threat of New Entrants
- 4.8.2 Bargaining Power of Suppliers
- 4.8.3 Bargaining Power of Buyers
- 4.8.4 Threat of Substitutes
- 4.8.5 Competitive Rivalry
- 4.9 Business and Operating Model (Agent Network, Liquidity, Interoperability)
- 4.10 Commercial Metrics and Unit Economics
- 4.10.1 Active Accounts (30/90-Day), ARPU/ARPA, Take-Rate, Revenue by Stream
- 4.10.2 Agent Density, Liquidity, Cash-Out Ratio, Transaction Mix
- 4.10.3 Cost to Serve, Fraud Loss Rate, Compliance Cost
- 4.10.4 Interoperability Impact (P2P/Merchant), Pricing Waterfalls
5 MARKET SIZE AND GROWTH FORECASTS (VALUE)
- 5.1 By Use Case
- 5.1.1 P2P Transfers
- 5.1.2 Merchant Payments
- 5.1.3 Bill Payments
- 5.1.4 Cash-In/Cash-Out
- 5.1.5 Bulk Disbursements
- 5.1.6 International Remittances
- 5.1.7 Savings/Wallets Interest
- 5.1.8 Credit/Nano-Loans
- 5.1.9 Insurance/Micro-Insure
- 5.2 By Transaction Corridor
- 5.2.1 Domestic
- 5.2.2 Cross-Border
- 5.3 By Access Channel
- 5.3.1 USSD/STK
- 5.3.2 App/QR/NFC
- 5.3.3 Agent POS/Feature phone
- 5.4 By Geography
- 5.4.1 South Asia
- 5.4.2 Southeast Asia
- 5.4.3 Middle East
- 5.4.4 Africa
6 COMPETITIVE LANDSCAPE
- 6.1 Market Concentration, 2025
- 6.2 Strategic Moves, 2023 - 2026
- 6.3 Market Share Analysis for Top Vendors, 2025
- 6.4 Company Profiles {(includes Global level Overview, Market level overview, Core Segments, Financials as available, Strategic Information, Market Rank/Share for key companies, Products and Services, and Recent Developments)}
- 6.4.1 Vodacom Group Limited
- 6.4.2 MTN Group Limited
- 6.4.3 Orange S.A.
- 6.4.4 Bharti Airtel Limited
- 6.4.5 Millicom International Cellular S.A.
- 6.4.6 Safaricom PLC
- 6.4.7 Viettel Military Industry and Telecoms Group
- 6.4.8 Jazz (Pakistan Mobile Communications Limited (PMCL))
- 6.4.9 Globe Telecom, Inc.
- 6.4.10 Ethio Telecom
- 6.4.11 Etisalat (Emirates Telecommunications Group Company PJSC)
7 MARKET OPPORTUNITIES AND FUTURE OUTLOOK
- 7.1 White-Space and Unmet-Need Assessment
- 7.2 Analyst Recommendations and Suggestions

