PUBLISHER: Mordor Intelligence | PRODUCT CODE: 2044031

PUBLISHER: Mordor Intelligence | PRODUCT CODE: 2044031
Fiber Mobile Backhaul System - Market Share Analysis, Industry Trends & Statistics, Growth Forecasts (2026 - 2031)
The Fiber Mobile Backhaul System Market size is projected to expand from USD 12.98 billion in 2025 and USD 14.65 billion in 2026 to USD 25.13 billion by 2031, registering a CAGR of 11.40% between 2026 to 2031.
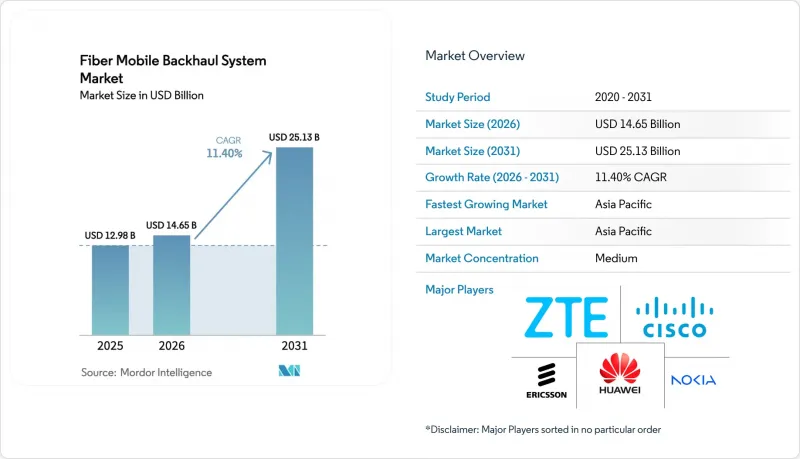
Momentum is accelerating because operators are upgrading constrained microwave links to fiber routes that can aggregate multi-terabit traffic generated by dense 5G clusters. Asia-Pacific carriers now budget more for transport than for radio, a reversal of the 4G era, while North American tier-1s are standardizing 100 Gbps wavelengths for every new macro site. The fiber mobile backhaul system market is also being reshaped by coherent pluggable optics that merge IP and optical layers inside a single chassis, trimming power bills by more than half and shortening service-activation cycles to minutes. Tower companies and neutral-host providers are buying dark fiber directly, eroding incumbent vendors' managed-service margins, and open transport specifications published by the Telecom Infra Project are accelerating multi-vendor deployments.
Global Fiber Mobile Backhaul System Market Trends and Insights
5G Densification and Exponential Data Traffic Growth
Mobile data traffic jumped 28% year-on-year in 2025, and 5G subscribers are already consuming a median of 42 GB monthly, triple the 4G baseline. Urban operators routinely deploy 8-12 small cells per city block, each demanding peak-hour throughput above 10 Gbps, a load that microwave cannot support once aggregate capacity tops 25 Gbps. Verizon reported 34% lower latency and 19% higher uplink throughput after migrating congested microwave links to fiber in dense metros. China Mobile earmarked USD 8.2 billion for fiber transport in its 2025 budget, reflecting the strategic primacy of backhaul within 5G economics. Operators now default to 100 Gbps wavelengths for new macro sites and plan to exceed 50 Gbps per site by 2028. Continuous traffic growth, therefore, locks in multi-year demand for the fiber mobile backhaul system market.
Adoption of Coherent Pluggable Optics (400G/800G ZR/ZR+)
Coherent pluggable transceivers, such as 400 G ZR and ZR+, reduce the cost and footprint of long-haul transport. Cisco's Routed Optical Networking platforms recorded a 62% reduction in power consumption per transported terabit compared with separate transponders. The optics extend metro DWDM links by 120 km without amplification, eliminating regeneration sites and reducing right-of-way costs by roughly 30%. Juniper said 18% of its routers shipped in Q1 2026 already carry embedded ZR+ optics, up from 4% a year earlier. Lumentum shipped more than 50,000 coherent modules in Q4 2025 and faces a backlog into late 2026. These advances allow operators to converge IP and optical layers, automate wavelength activation in under 10 minutes, and scale capacity by swapping optics rather than overhauling shelves, a paradigm that sustains double-digit growth for the fiber mobile backhaul system market.
High CAPEX and Right-of-Way Hurdles for Fiber Deployment
Deploying urban fiber often costs USD 80,000-150,000 per route-kilometer, with permitting accounting for up to half of that total. Many U.S. cities levy linear-foot fees of USD 2.50-6.00 and require performance bonds of USD 500,000 or more before trenching, a burden that delays neutral-host builds. AT&T disclosed 24-month average approval cycles for tower-fiber projects in key states, forcing reliance on interim microwave links. Environmental reviews under national statutes can push timelines past 3 years, while an 18% rise in installation labor costs in 2025 squeezed project margins. Such frictions temper the otherwise robust expansion of the fiber mobile backhaul system market.
Other drivers and restraints analyzed in the detailed report include:
- Proliferation of Small-Cell and C-RAN Architectures
- Government-Funded Rural Fiber Initiatives
- Supply-Chain Volatility for Specialty Fiber and Coherent DSPs
For complete list of drivers and restraints, kindly check the Table Of Contents.
Segment Analysis
DWDM secured 43.78% of the fiber mobile backhaul market share in 2025 by aggregating hundreds of cell-site wavelengths on a single pair. The segment is migrating from 10X10 Gbps grids to 400 Gbps ZR+ pluggables that fit into QSFP-DD slots, collapsing three rack units of legacy transponders into a single module. Ciena's WaveLogic 6 Extreme pushes 1.6 Tbps per wavelength over metro spans, quadrupling capacity without laying new fiber. Operators overlay fresh DWDM layers on dark fiber acquired years earlier, deferring costly trenching and lifting the fiber, and boosting the mobile backhaul system market size for coherent optics platforms.
Passive optical network solutions, led by XGS-PON and NG-PON2, are growing at 12.01% through 2031 as rural builds exploit split ratios of up to 1:64 to minimize stranded capex. Nokia's Lightspan delivered 25 Gbps symmetrical PON to 8,000 rural towers in Southeast Asia under a USD 120 million deal. Ethernet over fiber stays dominant in enterprise private 5G because deterministic latency matters more than spectral efficiency, and CWDM persists in fiber-abundant suburbs. Regulatory overhead is low because the spectrum is unlicensed, but obtaining permits for new routes remains a local hurdle. The competition between coherent DWDM and PON illustrates the bifurcated demand profile that propels the broader fiber mobile backhaul system market.
The Fiber Mobile Backhaul System Market Report is Segmented by Fiber Technology (DWDM, CWDM, Ethernet Over Fiber, and More), Bandwidth Capacity Tier (<=10 Gbps, 10-25 Gbps, 25-100 Gbps, >100 Gbps), End-User Industries (Mobile Network Operators, Neutral Host and TowerCos, Enterprises and Private 5G Networks, and More), and Geography. The Market Forecasts are Provided in Terms of Value (USD).
Geography Analysis
Asia-Pacific generated 29.67% of 2025 global revenue and will post a 13.32% CAGR to 2031, the fastest of any region. China Mobile spent USD 18.4 billion on transport in 2025, upgrading 580,000 base stations in tier-2 and tier-3 cities with 100 Gbps coherent backhaul. Bharti Airtel committed USD 2.1 billion to fiberize 120,000 rural towers under BharatNet III, leveraging state co-funding to extend reach. NTT Docomo finished a nationwide 100 Gbps rollout in March 2025 and is trialing 800 Gbps ZR+ optics to support latency-sensitive XR services in 2026. South Korean carriers are testing holographic calling that requires 1 Gbps per user, reinforcing the long-term pull on the fiber mobile backhaul market in the region.
North America captured 26% of 2025 revenue and is forecast to expand at 10.8%. Verizon and AT&T invested USD 4.7 billion combined in fiber backhaul during 2025, focusing on C-band sites that exceed 30 Gbps peak traffic. Rogers and Telus earmarked more than CAD 1 billion (USD 740 million) to fiberize towers across Ontario and British Columbia. Tower specialists American Tower and Crown Castle boosted fiber route-miles by double digits, offering neutral-host transport that accelerates 5G densification for smaller carriers. These moves sustain a sizable share of the fiber mobile backhaul system market in the United States and Canada.
Europe represented 23% of 2025 revenue and is expanding at 10.2% on the back of sustainability mandates and open transport. Deutsche Telekom found that fiber backhaul consumes 58% less energy per transported terabit than microwave backhaul, helping it meet its net-zero pledge. Vodafone is rolling out Open RAN across 2,500 sites in the UK and Germany with disaggregated Ciena and ADVA transport to curb vendor lock-in. Orange devoted EUR 1.2 billion in 2025 to upgrade 45,000 cell sites with 100 Gbps coherent links. Middle Eastern carriers such as STC ordered USD 280 million in DWDM gear for Riyadh and Jeddah smart-city corridors. African rollouts remain uneven; South Africa and Nigeria lead with fiberized urban cores, while microwave endures elsewhere, keeping the regional fiber mobile backhaul system industry at an earlier stage of maturity.
- Huawei Technologies Co., Ltd.
- Telefonaktiebolaget LM Ericsson (Ericsson)
- Nokia Corporation
- Cisco Systems, Inc.
- ZTE Corporation
- Ciena Corporation
- Infinera Corporation
- ADTRAN Holdings, Inc.
- Fujitsu Limited
- NEC Corporation
- Ribbon Communications Inc.
- Corning Incorporated
- Prysmian S.p.A.
- Sterlite Technologies Limited
- CommScope Holding Company, Inc. (Amphenol Corporation)
- Juniper Networks, Inc.
- Tejas Networks Limited
- FiberHome Telecommunication Technologies Co., Ltd.
- VIAVI Solutions Inc.
- Coherent Corp.
- Lumentum Holdings Inc.
- Broadcom Inc.
- Accelink Technologies Co., Ltd.
- AFL Telecommunications LLC
- Calix, Inc.
Additional Benefits:
- The market estimate (ME) sheet in Excel format
- 3 months of analyst support
TABLE OF CONTENTS
1 INTRODUCTION
- 1.1 Study Assumptions and Market Definition
- 1.2 Scope of the Study
2 RESEARCH METHODOLOGY
3 EXECUTIVE SUMMARY
4 MARKET LANDSCAPE
- 4.1 Market Overview
- 4.2 Market Drivers
- 4.2.1 5G Densification and Exponential Data Traffic Growth
- 4.2.2 Proliferation of Small-Cell and C-RAN Architectures
- 4.2.3 Government-Funded Rural Fiber Initiatives
- 4.2.4 Adoption of Coherent Pluggable Optics (400 G/800 G ZR/ZR+)
- 4.2.5 Open and Disaggregated Transport Ecosystems (TIP OOPT, OpenZR+)
- 4.2.6 Sustainability-Linked Financing Replacing Microwave with Energy-Efficient Fiber
- 4.3 Market Restraints
- 4.3.1 High CAPEX and Right-of-Way Hurdles for Fiber Deployment
- 4.3.2 Terrain Constraints Favoring Wireless Alternatives in Remote Areas
- 4.3.3 Supply-Chain Volatility for Specialty Fiber and Coherent DSPs
- 4.3.4 Escalating Cyber-Physical Threats to Critical Fiber Routes
- 4.4 Industry Value Chain Analysis
- 4.5 Regulatory Landscape
- 4.6 Technological Outlook
- 4.7 Porter's Five Forces Analysis
- 4.7.1 Competitive Rivalry
- 4.7.2 Threat of New Entrants
- 4.7.3 Threat of Substitutes
- 4.7.4 Bargaining Power of Suppliers
- 4.7.5 Bargaining Power of Buyers
- 4.8 Backhaul Architecture Analysis
- 4.8.1 Point-to-Point (P2P)
- 4.8.2 Ring
- 4.8.3 Daisy Chain
- 4.8.4 Others
5 MARKET SIZE AND GROWTH FORECASTS (VALUE)
- 5.1 By Fiber Technology
- 5.1.1 DWDM
- 5.1.2 CWDM
- 5.1.3 Ethernet over Fiber
- 5.1.4 Passive Optical Network (XGS-PON, NG-PON 2)
- 5.1.5 Other Fiber Technologies
- 5.2 By Bandwidth Capacity Tier
- 5.2.1 <=10 Gbps
- 5.2.2 10-25 Gbps
- 5.2.3 25-100 Gbps
- 5.2.4 >100 Gbps
- 5.3 By End-user Industry
- 5.3.1 Mobile Network Operators
- 5.3.2 Neutral Host and TowerCos
- 5.3.3 Enterprises and Private 5G Networks
- 5.3.4 Government and Public Safety
- 5.3.5 Cloud and OTT Providers
- 5.3.6 Other End-user Industries
- 5.4 By Geography
- 5.4.1 North America
- 5.4.1.1 United States
- 5.4.1.2 Canada
- 5.4.1.3 Mexico
- 5.4.2 South America
- 5.4.2.1 Brazil
- 5.4.2.2 Argentina
- 5.4.2.3 Rest of South America
- 5.4.3 Europe
- 5.4.3.1 Germany
- 5.4.3.2 United Kingdom
- 5.4.3.3 France
- 5.4.3.4 Russia
- 5.4.3.5 Rest of Europe
- 5.4.4 Asia-Pacific
- 5.4.4.1 China
- 5.4.4.2 Japan
- 5.4.4.3 India
- 5.4.4.4 South Korea
- 5.4.4.5 Rest of Asia-Pacific
- 5.4.5 Middle East and Africa
- 5.4.5.1 Middle East
- 5.4.5.1.1 Saudi Arabia
- 5.4.5.1.2 United Arab Emirates
- 5.4.5.1.3 Rest of the Middle East
- 5.4.5.2 Africa
- 5.4.5.2.1 South Africa
- 5.4.5.2.2 Nigeria
- 5.4.5.2.3 Rest of Africa
- 5.4.5.1 Middle East
- 5.4.1 North America
6 COMPETITIVE LANDSCAPE
- 6.1 Market Concentration
- 6.2 Strategic Moves
- 6.3 Market Share Analysis
- 6.4 Company Profiles (includes Global level Overview, Market level overview, Core Segments, Financials, Strategic Information, Market Rank/Share, Products and Services, Recent Developments)
- 6.4.1 Huawei Technologies Co., Ltd.
- 6.4.2 Telefonaktiebolaget LM Ericsson (Ericsson)
- 6.4.3 Nokia Corporation
- 6.4.4 Cisco Systems, Inc.
- 6.4.5 ZTE Corporation
- 6.4.6 Ciena Corporation
- 6.4.7 Infinera Corporation
- 6.4.8 ADTRAN Holdings, Inc.
- 6.4.9 Fujitsu Limited
- 6.4.10 NEC Corporation
- 6.4.11 Ribbon Communications Inc.
- 6.4.12 Corning Incorporated
- 6.4.13 Prysmian S.p.A.
- 6.4.14 Sterlite Technologies Limited
- 6.4.15 CommScope Holding Company, Inc. (Amphenol Corporation)
- 6.4.16 Juniper Networks, Inc.
- 6.4.17 Tejas Networks Limited
- 6.4.18 FiberHome Telecommunication Technologies Co., Ltd.
- 6.4.19 VIAVI Solutions Inc.
- 6.4.20 Coherent Corp.
- 6.4.21 Lumentum Holdings Inc.
- 6.4.22 Broadcom Inc.
- 6.4.23 Accelink Technologies Co., Ltd.
- 6.4.24 AFL Telecommunications LLC
- 6.4.25 Calix, Inc.
7 MARKET OPPORTUNITIES AND FUTURE OUTLOOK
- 7.1 White-Space and Unmet-Need Assessment
- 7.2 Analyst Recommendations and Suggestions

