PUBLISHER: Mordor Intelligence | PRODUCT CODE: 2044034

PUBLISHER: Mordor Intelligence | PRODUCT CODE: 2044034
Direct-to-Device Satellite Connectivity - Market Share Analysis, Industry Trends & Statistics, Growth Forecasts (2026 - 2031)
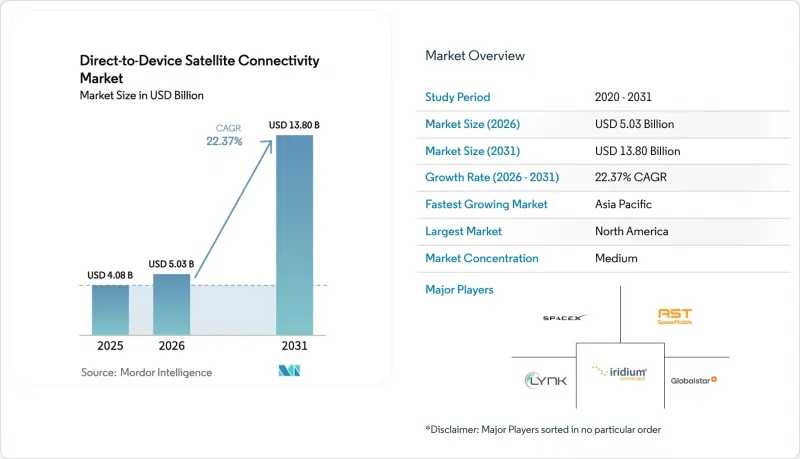
The Direct-to-Device Satellite Connectivity Market size was valued at USD 4.08 billion in 2025 and is estimated to grow from USD 5.03 billion in 2026 to reach USD 13.80 billion by 2031, at a CAGR of 22.37% during the forecast period (2026-2031). Rapid adoption of 3GPP-compliant non-terrestrial network (NTN) chipsets by smartphone and wearable makers, falling small-satellite launch costs, and explicit rural-coverage mandates in major economies have moved satellite links from a niche safety feature to a mainstream layer in consumer devices. Mobile network operators in North America, Asia-Pacific, and Europe now bundle satellite text and voice in premium plans, accelerating mass-market awareness and compressing payback periods for low-Earth-orbit (LEO) constellations. Consumer willingness to pay for ubiquitous coverage is helped by monthly price points of USD 15-20, well below legacy satellite-phone tariffs, while enterprises view satellite IoT as an insurance policy against logistics disruptions. Competitive intensity is rising as vertically integrated LEO players leverage launch economies of scale and chipset vendors pursue horizontal partnerships that spread NTN integration costs across many handset brands.
Global Direct-to-Device Satellite Connectivity Market Trends and Insights
Rapid Expansion of NTN-Compatible Smartphones
More than 150 million handsets shipped in 2025 with Release-17 NTN radios, making satellite connectivity a default feature in flagship and upper-midrange tiers. Apple, Samsung, Huawei, and multiple Android OEMs leveraged horizontal chipset platforms to avoid proprietary ground infrastructure, while the Federal Communications Commission's Supplemental Coverage from Space rules removed regulatory ambiguity in the United States. This scale effect spreads integration cost across a broader base, reduces retail price premiums, and primes users to expect seamless fallback when leaving terrestrial coverage.
Falling Launch Costs Due to Rideshare and Reusable Rockets
SpaceX regularly posts launch prices below USD 1 million for 200 kg payloads on Falcon 9 rideshare missions, a 60% reduction compared to typical expendable rockets in 2020. Lower launch capex lets emerging operators such as Sateliot and Lynk Global orbit small batches, test in situ, then iterate, compressing constellation build-out timelines. Blue Origin's New Glenn vehicle, expected to be online in 2026, will expand launch capacity, reinforcing a virtuous cycle of faster deployment and cheaper incremental capacity.
Spectrum Coexistence with Terrestrial MNOs
Mobile operators argue that satellite downlinks spill into International Mobile Telecommunications bands, degrading urban uplinks. While U.S. rules cap unwanted emissions at -20 dBW/MHz, Europe has yet to harmonize thresholds, forcing country-by-country approvals that slow rollouts. Smaller satellite players lacking advanced beam-forming face costly redesigns, and lobbying by terrestrial incumbents seeks even stricter limits, injecting short-term deployment risk.
Other drivers and restraints analyzed in the detailed report include:
- 3GPP Release-17 NTN Standardization Uptake
- National Rural-Coverage Mandates
- Limited Revenue-Generating Use-Cases Beyond SOS/Messaging
For complete list of drivers and restraints, kindly check the Table Of Contents.
Segment Analysis
L-band captured 41.53% of 2025 revenue within the direct-to-device satellite connectivity market, benefiting from decades-old Iridium and Globalstar assets that interoperate with existing chipsets and penetrate foliage and light structures. These characteristics underpin public-safety mandates and enterprise remote-worker kits, sustaining a sizable installed base. However, data-hungry use cases are drawing attention to Ku- and Ka-bands, where wider channels enable video conferencing and cloud access on handheld devices. 3GPP Release-18 standardized Ka-band NTN signaling, clearing a regulatory hurdle that had discouraged handset vendors from integrating antennas optimised for 27-40 GHz links.
Ka-band shipments are forecast to grow at a 25.61% CAGR, and several operators are leasing existing geostationary capacity to seed service before the launch of dedicated LEO craft. This hybrid model accelerates go-to-market while preserving capital. Over the forecast, Ka-band's share of the direct-to-device satellite connectivity market size is projected to close the gap with L-band as BlueBird, OneWeb-Eutelsat, and Viasat demonstrate multi-Mbps links on unmodified phones. Competitive advantage will hinge on beam-forming sophistication that keeps power budgets within handset limits and on coordinated spectrum rights that avoid urban interference, factors likely to consolidate supply around a handful of technically advanced players.
The Direct-To-Device Satellite Connectivity Market Report is Segmented by Frequency Band (L-Band, S-Band, Ku-Band, Ka-Band, More), Device Type (Smartphones, Iot Modules and Sensors, Wearables, Laptops and Tablets, and Connected Vehicles), End-User Industry (Consumer Electronics, Maritime, and More), and Geography. The Market Forecasts are Provided in Terms of Value (USD).
Geography Analysis
North America retained 39.22% of 2025 revenue, anchored by FCC rule clarity and the USD 20.4 billion Rural Digital Opportunity Fund, which subsidizes satellite service in unserved areas. SpaceX and T-Mobile added over 3 million direct-to-cell subscribers by early 2026, validating consumer appetite and creating network effects that encourage handset vendors to ship NTN-ready devices. Canada leverages Telesat's Lightspeed LEO network for Arctic and prairie communities, while Mexico eyes Starlink backhaul for federal connectivity programs. Venture capital density, reusable-rocket leadership, and dual-use military interest collectively sustain the region's lead.
Asia-Pacific is forecast to post a 26.62% CAGR, propelled by China's integration of Beidou messaging in Huawei and Xiaomi handsets, India's administrative spectrum allocation that removes auction friction for OneWeb-Eutelsat and Jio-SES, and Japan's KDDI-Starlink and Rakuten-AST SpaceMobile partnerships. Australia's Regional Telecommunications Review endorsed satellite as the default option for its outback, and Telstra now bundles Starlink backhaul for remote towers. Dense urban markets such as South Korea use satellite mainly for maritime coverage and disaster resilience, but long-term demand from autonomous vehicles could expand indoor urban use cases.
Europe, South America, and Middle East, and Africa split the remainder. European rollouts await harmonized coexistence rules from CEPT, delaying broad commercial service despite Eutelsat OneWeb pilots with Vodafone and Orange. Brazil's Anatel mandates coverage of the Amazon basin, positioning satellite as the only scalable solution for schools and clinics. In the Middle East and Africa, Yahsat and Thuraya serve government, energy, and NGO users; growth hinges on handset price declines and prepaid IoT plans that match local spending power.
List of Companies Covered in this Report:
- Space Exploration Technologies Corp.
- AST SpaceMobile, Inc.
- Lynk Global, Inc.
- Iridium Communications Inc.
- Globalstar, Inc.
- Viasat, Inc.
- Eutelsat S.A.
- Omnispace LLC
- Sateliot, S.L.
- Skylo Technologies, Inc.
- Kepler Communications Inc.
- Al Yah Satellite Communications Company PJSC
- Hiber Global B.V.
- Qualcomm Incorporated
- MediaTek Inc.
- Apple Inc.
- Bullitt Group Ltd.
- Samsung Electronics Co., Ltd.
- Huawei Technologies Co., Ltd.
- T-Mobile US, Inc.
Additional Benefits:
- The market estimate (ME) sheet in Excel format
- 3 months of analyst support
TABLE OF CONTENTS
1 INTRODUCTION
- 1.1 Study Assumptions and Market Definition
- 1.2 Scope of the Study
2 RESEARCH METHODOLOGY
3 EXECUTIVE SUMMARY
4 MARKET LANDSCAPE
- 4.1 Market Overview
- 4.2 Market Drivers
- 4.2.1 Rapid Expansion of NTN-Compatible Smartphones
- 4.2.2 Falling Launch Costs Due to Rideshare and Reusable Rockets
- 4.2.3 3GPP Release-17 NTN Standardization Uptake
- 4.2.4 National Rural-Coverage Mandates (US, India, AU, BR)
- 4.2.5 Demand from Unmanned Systems (UAVs and UGVs)
- 4.2.6 Emerging Pay-As-You-Go IoT Micro-Data Plans
- 4.3 Market Restraints
- 4.3.1 Spectrum Coexistence With Terrestrial MNOs
- 4.3.2 User-Terminal Power-Budget Constraints Inside Handsets
- 4.3.3 Regulatory Uncertainty on Cross-Border Service Rights
- 4.3.4 Limited Revenue-Generating Use-Cases Beyond SOS/ Messaging
- 4.4 Industry Value Chain Analysis
- 4.5 Regulatory Landscape
- 4.6 Technological Outlook
- 4.7 Porter's Five Forces Analysis
- 4.7.1 Bargaining Power of Suppliers
- 4.7.2 Bargaining Power of Buyers
- 4.7.3 Threat of New Entrants
- 4.7.4 Threat of Substitutes
- 4.7.5 Competitive Rivalry
5 MARKET SIZE AND GROWTH FORECASTS (VALUE)
- 5.1 By Frequency Band
- 5.1.1 L-Band
- 5.1.2 S-Band
- 5.1.3 Ku-Band
- 5.1.4 Ka-Band
- 5.1.5 Other Frequency Bands (UHF, X-Band)
- 5.2 By Device Type
- 5.2.1 Smartphones
- 5.2.2 IoT Modules and Sensors
- 5.2.3 Wearables
- 5.2.4 Laptops and Tablets
- 5.2.5 Connected Vehicles
- 5.3 By End-User Industry
- 5.3.1 Consumer Electronics
- 5.3.2 Maritime
- 5.3.3 Aviation
- 5.3.4 Logistics and Transportation
- 5.3.5 Agriculture
- 5.3.6 Energy and Utilities
- 5.3.7 Government and Defense
- 5.3.8 Other End-user Industries
- 5.4 By Geography
- 5.4.1 North America
- 5.4.1.1 United States
- 5.4.1.2 Canada
- 5.4.1.3 Mexico
- 5.4.2 South America
- 5.4.2.1 Brazil
- 5.4.2.2 Argentina
- 5.4.2.3 Rest of South America
- 5.4.3 Europe
- 5.4.3.1 Germany
- 5.4.3.2 United Kingdom
- 5.4.3.3 France
- 5.4.3.4 Russia
- 5.4.3.5 Rest of Europe
- 5.4.4 Asia-Pacific
- 5.4.4.1 China
- 5.4.4.2 Japan
- 5.4.4.3 India
- 5.4.4.4 South Korea
- 5.4.4.5 Rest of Asia-Pacific
- 5.4.5 Middle East and Africa
- 5.4.5.1 Middle East
- 5.4.5.1.1 Saudi Arabia
- 5.4.5.1.2 United Arab Emirates
- 5.4.5.1.3 Rest of the Middle East
- 5.4.5.2 Africa
- 5.4.5.2.1 South Africa
- 5.4.5.2.2 Nigeria
- 5.4.5.2.3 Rest of Africa
- 5.4.5.1 Middle East
- 5.4.1 North America
6 COMPETITIVE LANDSCAPE
- 6.1 Market Concentration
- 6.2 Strategic Moves
- 6.3 Market Share Analysis
- 6.4 Company Profiles (includes Global level Overview, Market level overview, Core Segments, Financials as available, Strategic Information, Market Rank/Share for key companies, Products and Services, and Recent Developments)
- 6.4.1 Space Exploration Technologies Corp.
- 6.4.2 AST SpaceMobile, Inc.
- 6.4.3 Lynk Global, Inc.
- 6.4.4 Iridium Communications Inc.
- 6.4.5 Globalstar, Inc.
- 6.4.6 Viasat, Inc.
- 6.4.7 Eutelsat S.A.
- 6.4.8 Omnispace LLC
- 6.4.9 Sateliot, S.L.
- 6.4.10 Skylo Technologies, Inc.
- 6.4.11 Kepler Communications Inc.
- 6.4.12 Al Yah Satellite Communications Company PJSC
- 6.4.13 Hiber Global B.V.
- 6.4.14 Qualcomm Incorporated
- 6.4.15 MediaTek Inc.
- 6.4.16 Apple Inc.
- 6.4.17 Bullitt Group Ltd.
- 6.4.18 Samsung Electronics Co., Ltd.
- 6.4.19 Huawei Technologies Co., Ltd.
- 6.4.20 T-Mobile US, Inc.
7 MARKET OPPORTUNITIES AND FUTURE OUTLOOK
- 7.1 White-space and Unmet-Need Assessment

