
PUBLISHER: Mordor Intelligence | PRODUCT CODE: 2044051

PUBLISHER: Mordor Intelligence | PRODUCT CODE: 2044051
Smart Finance Connectivity - Market Share Analysis, Industry Trends & Statistics, Growth Forecasts (2026 - 2031)
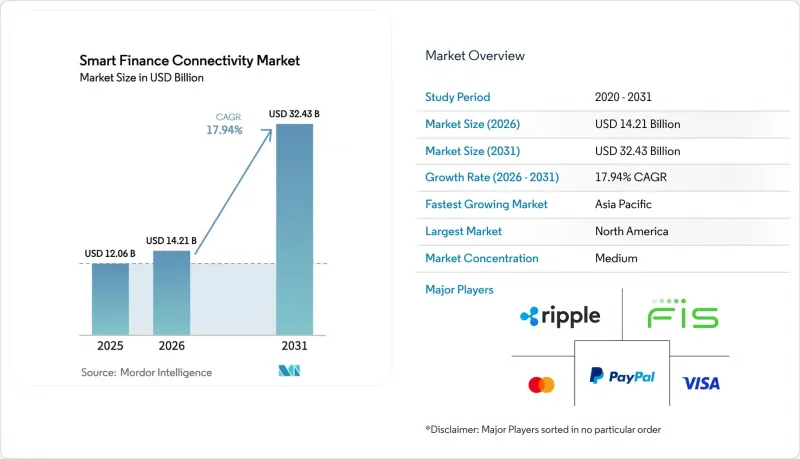
The smart finance connectivity market size is projected to be USD 12.06 billion in 2025, USD 14.21 billion in 2026, and reach USD 32.43 billion by 2031, growing at a CAGR of 17.94% from 2026 to 2031.
Rising regulatory mandates for open banking, the proliferation of real-time payment rails, and artificial-intelligence-powered application programming interfaces are rewiring how capital, data, and authentication flow between banks, fintechs, and software platforms. Enterprises across regions are embedding payment, lending, and identity services directly into e-commerce, mobility, and software-as-a-service workflows, compressing the distance between a customer action and a financial transaction. Competitive intensity has sharpened as horizontal multi-rail platforms and vertical specialists race to become the connective tissue for programmable finance. Operational resilience, data portability, and zero-trust security are now table-stakes capabilities rather than differentiators, raising the execution bar for incumbents and new entrants alike.
Global Smart Finance Connectivity Market Trends and Insights
Proliferation of Open Banking Regulations
Mandatory data-sharing frameworks are synchronizing banking, payments, and wealth information through standardized APIs, but execution remains uneven across jurisdictions. The revised Payment Services Directive 3 in the European Union expands coverage to insurance and investment accounts, forcing incumbent banks to expose multi-asset data sets by 2027. In the United States, the Consumer Financial Protection Bureau finalized Section 1033 in 2024, granting consumers the right to portable financial data yet delegating technical standards to private consortia, thereby extending negotiations over API schemas. Brazil's PIX Automatico, launched in 2025, proved that regulatory clarity drives merchant adoption, settling 5.71 billion transactions in one month. The United Arab Emirates reinforced the trend when Abu Dhabi Islamic Bank became the first Sharia-compliant institution to roll out certified open-finance APIs in 2026. Collectively, these mandates compress innovation cycles and expand the addressable smart finance connectivity market.
Rapid Rollout of 5G Networks Enabling Real-Time Financial Data
Ultra-low-latency 5G coverage permits fraud-detection engines and biometric authenticators to run at the network edge, unlocking sub-second authorization for high-value purchases. South Korea and China already cover more than 90% of urban populations, enabling financial-services firms to embed risk scoring directly in point-of-sale hardware. However, rural and tier-2 cities in emerging markets still rely on legacy networks, obliging platforms to maintain dual-mode APIs that switch between real-time and asynchronous settlement. The resulting architectural complexity favors providers with flexible orchestration layers and accelerates demand for the smart finance connectivity market.
Fragmented Legacy Core Banking Systems
Core modernization remains a multi-year, high-risk endeavor. An October 2025 EY study showed that 92% of banks had launched transformation programs, yet half opted for "hollow-the-core" hybrids that retain mainframes for records while exposing cloud APIs for customers. This dual mode introduces latency and data-synchronization errors that can negate cloud savings when real-time settlement is required. Full replacement projects, such as Egypt's MIDBANK "big-bang" migration completed in 2025, are exceptions rather than the norm and highlight execution risk. The drag on agility curbs the adoption velocity of the smart finance connectivity market.
Other drivers and restraints analyzed in the detailed report include:
- Integration of AI-Powered APIs for Hyper-Personalized Banking
- Demand for Embedded Finance in Non-Financial Apps
- Growing Cybersecurity and Data Privacy Concerns
For complete list of drivers and restraints, kindly check the Table Of Contents.
Segment Analysis
Services captured momentum with an 18.54% CAGR between 2026 and 2031 while software retained a 68.43% share of the smart finance connectivity market size in 2025. Mid-tier banks, credit unions, and digitally curious merchants lack in-house engineering capacity, so they outsource multi-jurisdictional regulatory updates, partner onboarding, and continuous API orchestration to managed-service providers. This need for operational muscle has reshaped vendor revenue mixes, tilting toward consumption-based models that scale with transaction volumes. Software, although dominant, is migrating from monolithic licenses to composable, API-first modules refreshed every three to five years. Low-code orchestration tools are lowering entry barriers for business users, yet they commoditize baseline platform layers, pushing vendors to differentiate through embedded analytics and pre-certified compliance bundles.
The services surge emphasizes the strategic value of operational resilience in the smart finance connectivity market. As enterprise clients demand guaranteed uptime, sub-second latency, and always-current regulatory mappings, providers offering round-the-clock monitoring and automated DevSecOps pipelines gain share. Conversely, legacy license vendors risk margin compression unless they pivot to recurring, outcome-based service agreements. This shift underscores why investors evaluate gross-profit retention, not bookings, when benchmarking smart finance connectivity industry valuations.
Account-to-account infrastructure is expanding at 18.79% CAGR, challenging longstanding card-rail dominance. Visa's February 2026 acquisition of Prisma and Newpay signals a strategic hedge, combining real-time payments and ATM networks with tokenization engines to preserve relevance as merchants pursue interchange-free transfers. Brazil's PIX processed 5.71 billion December 2024 transactions with 99.96% availability, proving that large-scale A2A systems can rival card reliability at lower cost. Data-aggregation APIs, identity layers, and consent frameworks still represent smaller revenue pools, yet rising decentralized-identity adoption positions them for future growth. Vendors capable of orchestrating ISO 20022 messages, W3C decentralized identifiers, and proprietary bank formats within one dashboard will control critical choke points in the smart finance connectivity market.
Open-banking and financial APIs held a 34.75% share in 2025 and remain foundational, but merchants and fintechs increasingly demand bundled multi-rail connectors that abstract underlying schemes. Competitive intensity is sharpening as cloud hyperscalers bundle payment gateways with analytics, and card networks inject risk-scoring and credential-on-file token services into A2A propositions. The resulting convergence blurs lines between data aggregation, payments, and identity, reaffirming the programmable nature of the smart finance connectivity market.
The Smart Finance Connectivity Market Report is Segmented by Component (Software, and Services), Connectivity Technology (Open Banking APIs, A2A Connectivity, and More), Deployment (On-Premises, Cloud, and Hybrid), Application (Payments and Digital Wallets, Lending and Credit Services, and More), End User (Banks, Fintechs, Insurance Companies, and More), and Geography. The Market Forecasts are in Value (USD).
Geography Analysis
North America led with 40.32% smart finance connectivity market share in 2025. The U.S. ride is powered by FedNow instant settlement and the CFPB Section 1033 data-portability rule, which forces data holders to expose consumer-permissioned interfaces. Market dynamics divide along bank-built proprietary networks and fintech aggregators such as Plaid that normalize data across institutions. Canada and Mexico experience adjacent growth via remittance flows and corridor-based innovations, yet regulatory alignment with the United States remains partial.
Asia-Pacific is the fastest-rising territory, advancing at 19.18% CAGR through 2031 as India's UPI scales internationally and China's digital yuan surpasses CNY 16.7 trillion (USD 2.3 trillion) in cumulative throughput by November 2025. Regional regulators synchronize QR standards and explore multilateral clearing, exemplified by Project Nexus and Alipay+ trials. Japan, South Korea, and Australia progress open-banking frameworks, while Southeast Asian economies prioritize instant cross-border payments to support tourism and gig-economy wages. These initiatives broaden the revenue pool for the smart finance connectivity market.
Europe sustains steady adoption, propelled by PSD3 drafts tightening liability and broadening scope to wealth accounts. The Berlin Group's NextGenPSD2 standard reduces cross-border integration costs, and EU-wide EUDI digital-identity wallets promise seamless know-your-customer workflows. South America's growth centers on Brazil's PIX system and Argentina's modernization after Visa's Prisma acquisition. The Middle East and Africa show emerging potential; Abu Dhabi Islamic Bank's open-finance roll-out under AlTareq and South Africa's interoperability mandate illustrate regulatory momentum. Collectively, geographic divergence in policy and infrastructure drives nuanced go-to-market strategies within the smart finance connectivity market.
- Visa Inc.
- Mastercard Inc.
- PayPal Holdings Inc.
- Ripple Labs Inc.
- Ant Group Co. Ltd.
- Tencent Holdings Ltd.
- Fiserv Inc.
- Fidelity National Information Services Inc.
- Temenos AG
- Finastra Group Holdings Limited
- Adyen N.V.
- Stripe Inc.
- Block Inc. (Square)
- Plaid Inc.
- SWIFT SCRL
- International Business Machines Corporation
- Oracle Corporation
- Amazon Web Services Inc.
- Google LLC
Additional Benefits:
- The market estimate (ME) sheet in Excel format
- 3 months of analyst support
TABLE OF CONTENTS
1 INTRODUCTION
- 1.1 Study Assumptions and Market Definition
- 1.2 Scope of the Study
2 RESEARCH METHODOLOGY
3 EXECUTIVE SUMMARY
4 MARKET LANDSCAPE
- 4.1 Market Overview
- 4.2 Market Drivers
- 4.2.1 Proliferation of Open Banking Regulations
- 4.2.2 Rapid Rollout of 5G Networks Enabling Real-Time Financial Data
- 4.2.3 Integration of AI-Powered APIs for Hyper-Personalized Banking
- 4.2.4 Accelerated Digital Payments Adoption Among SMEs
- 4.2.5 Demand for Embedded Finance in Non-Financial Apps
- 4.2.6 Rise of Decentralized Identity Standards in Financial Services
- 4.3 Market Restraints
- 4.3.1 Fragmented Legacy Core Banking Systems
- 4.3.2 Growing Cybersecurity and Data Privacy Concerns
- 4.3.3 High Compliance Costs in Multi-Jurisdictional Deployments
- 4.3.4 Limited Interoperability Between Proprietary FinTech Platforms
- 4.4 Industry Value Chain Analysis
- 4.5 Impact of Macroeconomic Factors on the Market
- 4.6 Regulatory Landscape
- 4.7 Technological Outlook
- 4.8 Porter's Five Forces Analysis
- 4.8.1 Bargaining Power of Buyers
- 4.8.2 Bargaining Power of Suppliers
- 4.8.3 Threat of New Entrants
- 4.8.4 Threat of Substitutes
- 4.8.5 Intensity of Competitive Rivalry
5 MARKET SIZE AND GROWTH FORECASTS (VALUE)
- 5.1 By Component
- 5.1.1 Software
- 5.1.2 Services
- 5.2 By Connectivity Technology
- 5.2.1 Open Banking and Financial APIs
- 5.2.2 Account-to-Account (A2A) Connectivity
- 5.2.3 Payment Rails Integration
- 5.2.4 Financial Data Exchange and Aggregation
- 5.2.5 Identity, Authentication and Consent Connectivity
- 5.3 By Deployment Mode
- 5.3.1 On-Premises
- 5.3.2 Cloud
- 5.3.3 Hybrid
- 5.4 By Application
- 5.4.1 Payments and Digital Wallets
- 5.4.2 Lending and Credit Services
- 5.4.3 Embedded Finance/Banking -as-a-service (BaaS)
- 5.4.4 Wealth and Asset Management
- 5.4.5 Insurance Connectivity
- 5.4.6 Regulatory, Risk, and Compliance Management
- 5.4.7 Personal and Business Financial Management Tools
- 5.5 By End User
- 5.5.1 Banks
- 5.5.2 FinTech Companies
- 5.5.3 Insurance Companies
- 5.5.4 Non-Banking Financial Institutions
- 5.5.5 Merchants and Digital Platforms
- 5.5.6 Enterprises and Marketplaces
- 5.6 By Geography
- 5.6.1 North America
- 5.6.1.1 United States
- 5.6.1.2 Canada
- 5.6.1.3 Mexico
- 5.6.2 South America
- 5.6.2.1 Brazil
- 5.6.2.2 Argentina
- 5.6.2.3 Rest of South America
- 5.6.3 Europe
- 5.6.3.1 Germany
- 5.6.3.2 United Kingdom
- 5.6.3.3 France
- 5.6.3.4 Italy
- 5.6.3.5 Spain
- 5.6.3.6 Rest of Europe
- 5.6.4 Asia-Pacific
- 5.6.4.1 China
- 5.6.4.2 Japan
- 5.6.4.3 India
- 5.6.4.4 South Korea
- 5.6.4.5 Australia
- 5.6.4.6 Rest of Asia-Pacific
- 5.6.5 Middle East and Africa
- 5.6.5.1 Middle East
- 5.6.5.1.1 Saudi Arabia
- 5.6.5.1.2 United Arab Emirates
- 5.6.5.1.3 Turkey
- 5.6.5.1.4 Rest of Middle East
- 5.6.5.2 Africa
- 5.6.5.2.1 South Africa
- 5.6.5.2.2 Egypt
- 5.6.5.2.3 Nigeria
- 5.6.5.2.4 Rest of Africa
- 5.6.5.1 Middle East
- 5.6.1 North America
6 COMPETITIVE LANDSCAPE
- 6.1 Market Concentration
- 6.2 Strategic Moves
- 6.3 Market Share Analysis
- 6.4 Company Profiles (includes Global level Overview, Market level overview, Core Segments, Financials as Available, Strategic Information, Market Rank/Share for Key Companies, Products and Services, and Recent Developments)
- 6.4.1 Visa Inc.
- 6.4.2 Mastercard Inc.
- 6.4.3 PayPal Holdings Inc.
- 6.4.4 Ripple Labs Inc.
- 6.4.5 Ant Group Co. Ltd.
- 6.4.6 Tencent Holdings Ltd.
- 6.4.7 Fiserv Inc.
- 6.4.8 Fidelity National Information Services Inc.
- 6.4.9 Temenos AG
- 6.4.10 Finastra Group Holdings Limited
- 6.4.11 Adyen N.V.
- 6.4.12 Stripe Inc.
- 6.4.13 Block Inc. (Square)
- 6.4.14 Plaid Inc.
- 6.4.15 SWIFT SCRL
- 6.4.16 International Business Machines Corporation
- 6.4.17 Oracle Corporation
- 6.4.18 Amazon Web Services Inc.
- 6.4.19 Google LLC
7 MARKET OPPORTUNITIES AND FUTURE OUTLOOK
- 7.1 White-space and Unmet-Need Assessment

