
PUBLISHER: Mordor Intelligence | PRODUCT CODE: 2044053

PUBLISHER: Mordor Intelligence | PRODUCT CODE: 2044053
SSD Caching - Market Share Analysis, Industry Trends & Statistics, Growth Forecasts (2026 - 2031)
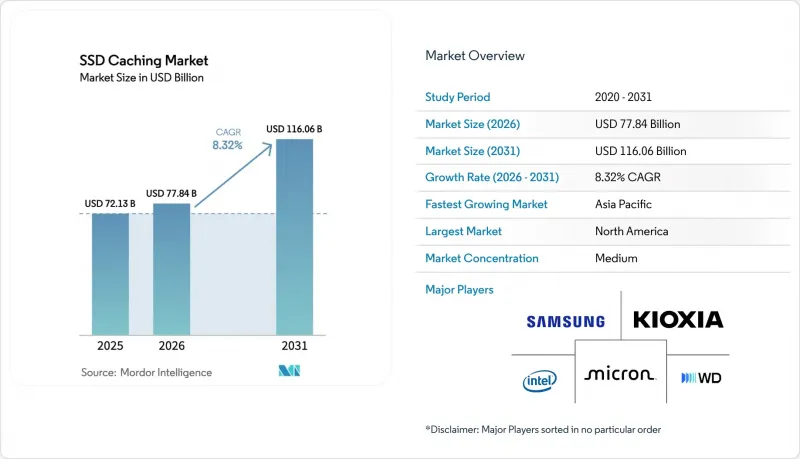
The SSD caching market size is expected to grow from USD 72.13 billion in 2025 to USD 77.84 billion in 2026 and is forecast to reach USD 116.06 billion by 2031 at 8.32% CAGR over 2026-2031.
Unrelenting demand for low-latency data services, the mainstreaming of PCIe 5.0 and Compute Express Link (CXL), and enterprise adoption of sovereign-AI workflows are lifting near-term revenue. Hardware share stays dominant, yet the pivot toward software-defined tiering is unmistakable as virtualization decouples performance tiers from physical media. Cloud-native deployments are accelerating because hyperscalers now expose NVMe-over-Fabrics as a routine service, while on-premise arrays defend share through consumption-based pricing. Competitive energy has moved from raw capacity to protocol interoperability and endurance, creating space for vendors that own both NAND fabrication and firmware road maps. Supply-chain volatility, geopolitical export controls, and emerging data-sovereignty rules remain the chief headwinds, but the SSD caching market continues to reward providers that combine vertical integration with flexible licensing.
Global SSD Caching Market Trends and Insights
Accelerated Adoption of NVMe-Based Data Centers
NVMe-over-Fabrics is replacing SATA and SAS, slashing latency from milliseconds to microseconds and allowing each drive to serve order-of-magnitude more IOPS. Intel reported that NVMe SSD attach rates in Xeon platforms exceeded 75% in Q1 2026, underscoring hyperscaler standardization. Kioxia's PCIe 5.0 CD9P drive delivers 14 GB/s reads, enabling one device to replace three Gen4 units and cut rack count, power, and cooling. The switch strains legacy block-protocol SANs, pushing enterprises toward software-defined storage fabrics that add license overhead but unlock sub-100-microsecond cache hits.
Rising Data Analytics Workloads Across Enterprises
Global data-warehouse query volumes expanded 42% year-over-year in 2025 as generative-AI workloads exploded, intensifying demand for sustained random reads. Dell noted a 63% shipment jump for PowerStore arrays with integrated NVMe caching among financial-services customers. SSD caches permit enterprises to stage hot datasets on a fraction of total capacity, postponing costly capacity upgrades while maintaining service-level agreements. Machine-learning-based prefetching is emerging to stabilize cache-hit ratios amid shifting access patterns.
High Upfront Capital Expenditure for Enterprise SSD Caches
Enterprise NVMe SSDs cost USD 0.80-1.20 per gigabyte versus USD 0.05 for nearline HDDs, a 16-24X delta that deters upgrades. Micron's 15% price hike in FY2025 reversed years of ASP declines as AI servers absorbed wafer output. Consumption-based programs like Pure Storage's Evergreen//Forever mitigate capex but remain sub-20% penetrated, creating a bifurcated market where hyperscalers advance and mid-tier buyers sweat Gen4 assets.
Other drivers and restraints analyzed in the detailed report include:
- Demand for Low-Latency Edge Computing Infrastructure
- Growth in Hyperconverged Infrastructure Deployments
- Complexity in Maintaining Multi-Tier Storage Architectures
For complete list of drivers and restraints, kindly check the Table Of Contents.
Segment Analysis
Write-through retained 45.88% of the market share in 2025, anchoring the SSD caching market as transactional databases insist on synchronous durability. Large financial and e-commerce platforms favor the design because every write is mirrored to the origin, eliminating data-loss concerns. Yet write-around will post the fastest growth at a 9.34% CAGR through 2031, reflecting analytics workloads where read latency trumps write speed. Software-defined arrays now let administrators toggle among caching modes per volume, injecting flexibility legacy controllers lack, and supporting the widening workload split within the SSD caching market.
The surge of PCIe 5.0 bandwidth permits ingest traffic to bypass cache without choking write-around arrays, removing a historic bottleneck. Snowflake and Databricks have standardized on the model for cloud warehouses that show 95% read ratios, signaling a broad architectural pivot. Meanwhile, write-back persists for mixed workloads but depends on battery-backed volatile buffers or persistent memory modules. Overall, the panoply of caching modes expands buyer choice and intensifies feature competition across the SSD caching market.
Hardware accounted for 68.63% of market share in 2025, but software-defined caching platforms are on pace for a 9.56% CAGR through 2031 as enterprises decouple logical performance layers from the underlying media. Platforms such as DataCore SANsymphony convert any block device into a cache tier, squeezing residual value from aging SAS drives and sliding PCIe 5.0 SSDs into the same cluster. This shift lowers vendor lock-in, though it pressures drive makers to embed smarter firmware to differentiate.
Micron's 9550 SSD integrates on-controller machine learning that predicts hot data. Samsung's Flexible Data Placement allows hosts to steer writes to high-endurance SLC within the same drive. These innovations blur the boundaries between hardware and software feature sets in the SSD caching market, prompting buyers to reassess total-cost-of-ownership frameworks.
The SSD Caching Market Report is Segmented by Architecture (Write-Through, Write-Back, and Write-Around), Component (Hardware and Software), Deployment Model (On-Premise and Cloud), Application (Enterprise Servers and Personal Computing), and Geography. The Market Forecasts are Provided in Terms of Value (USD).
Geography Analysis
North America led with 38.84% of the market share in 2025, anchored by hyperscale campuses in Virginia, Oregon, and Texas that consume thousands of PCIe 5.0 drives per month. Federal incentives under the CHIPS and Science Act encourage domestic assembly, and encryption mandates such as FIPS 140-3 narrow the supplier field to drives with certified secure firmware. Replacement cycles, however, lengthen beyond five years, moderating growth relative to other regions.
Asia-Pacific will post the fastest 9.91% CAGR through 2031. China's 14th Five-Year Plan targets 70% self-sufficiency in enterprise storage, spurring indigenous controller and NAND development. SK hynix is spending USD 3.9 billion to triple CXL module capacity by 2028, betting that cache-coherent memory will displace parts of the SSD caching market. India's data-center build-out, propelled by the Digital Personal Data Protection Act, doubles addressable floor space and lifts regional demand for cache devices tuned to humid, high-temperature environments.
Europe, the Middle East and Africa form a smaller but strategic cluster. GDPR compels in-region caching, benefitting colocation operators that pre-install NVMe arrays. Germany and the United Kingdom lead European spend, while Saudi Arabia and the UAE bankroll sovereign-cloud clusters to cut reliance on U.S. or Chinese hyperscalers. Microsoft Azure's expansion into Nigeria and Egypt highlights future pull, yet broad African adoption remains gated by inconsistent power grids and limited fiber, restraining the SSD caching market share there.
- Samsung Electronics Co., Ltd.
- Intel Corporation
- Kioxia Holdings Corporation
- Western Digital Corporation
- Micron Technology, Inc.
- SK hynix Inc.
- ASTERA LABS, INC.
- Kingston Technology Company, Inc.
- Hewlett Packard Enterprise Company
- Dell Technologies Inc.
- NetApp, Inc.
- Lenovo Group Limited
- Huawei Technologies Co., Ltd.
- Inspur Group Co., Ltd.
- Pure Storage, Inc.
- DataCore Software Corporation
- Nutanix, Inc.
- Montage Technology
- AccelStor, Inc.
Additional Benefits:
- The market estimate (ME) sheet in Excel format
- 3 months of analyst support
TABLE OF CONTENTS
1 INTRODUCTION
- 1.1 Study Assumptions and Market Definition
- 1.2 Scope of the Study
2 RESEARCH METHODOLOGY
3 EXECUTIVE SUMMARY
4 MARKET LANDSCAPE
- 4.1 Market Overview
- 4.2 Market Drivers
- 4.2.1 Accelerated Adoption of NVMe-Based Data Centers
- 4.2.2 Rising Data Analytics Workloads Across Enterprises
- 4.2.3 Demand for Low-Latency Edge Computing Infrastructure
- 4.2.4 Growth in Hyperconverged Infrastructure Deployments
- 4.2.5 Mainstreaming of PCIe 5.0 and CXL Protocol Support
- 4.2.6 Enhanced SSD Endurance Through AI-Enabled Wear-Leveling
- 4.3 Market Restraints
- 4.3.1 High Upfront Capital Expenditure for Enterprise SSD Caches
- 4.3.2 Complexity in Maintaining Multi-Tier Storage Architectures
- 4.3.3 Limited Performance Gains for Write-Intensive Workloads
- 4.3.4 Supply Chain Volatility in Advanced NAND Components
- 4.4 Impact of Macroeconomic Factors on the Market
- 4.5 Industry Supply-Chain Analysis
- 4.6 Regulatory Landscape
- 4.7 Technological Outlook
- 4.8 Porter's Five Forces Analysis
- 4.8.1 Threat of New Entrants
- 4.8.2 Bargaining Power of Suppliers
- 4.8.3 Bargaining Power of Buyers
- 4.8.4 Threat of Substitutes
- 4.8.5 Intensity of Competitive Rivalry
5 MARKET SIZE AND GROWTH FORECASTS (VALUE)
- 5.1 By Architecture
- 5.1.1 Write-Through
- 5.1.2 Write-Back
- 5.1.3 Write-Around
- 5.2 By Component
- 5.2.1 Hardware
- 5.2.2 Software
- 5.3 By Deployment Model
- 5.3.1 On-Premise
- 5.3.2 Cloud
- 5.4 By Application
- 5.4.1 Enterprise Servers
- 5.4.2 Personal Computing
- 5.5 By Geography
- 5.5.1 North America
- 5.5.1.1 United States
- 5.5.1.2 Canada
- 5.5.1.3 Mexico
- 5.5.2 South America
- 5.5.2.1 Brazil
- 5.5.2.2 Argentina
- 5.5.2.3 Rest of South America
- 5.5.3 Europe
- 5.5.3.1 Germany
- 5.5.3.2 United Kingdom
- 5.5.3.3 France
- 5.5.3.4 Italy
- 5.5.3.5 Spain
- 5.5.3.6 Rest of Europe
- 5.5.4 Asia-Pacific
- 5.5.4.1 China
- 5.5.4.2 Japan
- 5.5.4.3 India
- 5.5.4.4 South Korea
- 5.5.4.5 Australia
- 5.5.4.6 Rest of Asia-Pacific
- 5.5.5 Middle East and Africa
- 5.5.5.1 Middle East
- 5.5.5.1.1 Saudi Arabia
- 5.5.5.1.2 United Arab Emirates
- 5.5.5.1.3 Turkey
- 5.5.5.1.4 Rest of Middle East
- 5.5.5.2 Africa
- 5.5.5.2.1 South Africa
- 5.5.5.2.2 Egypt
- 5.5.5.2.3 Nigeria
- 5.5.5.2.4 Rest of Africa
- 5.5.5.1 Middle East
- 5.5.1 North America
6 COMPETITIVE LANDSCAPE
- 6.1 Market Concentration
- 6.2 Strategic Moves
- 6.3 Market Share Analysis
- 6.4 Company Profiles (includes Global level Overview, Market level overview, Core Segments, Financials as Available, Strategic Information, Market Rank/Share for Key Companies, Products and Services, and Recent Developments)
- 6.4.1 Samsung Electronics Co., Ltd.
- 6.4.2 Intel Corporation
- 6.4.3 Kioxia Holdings Corporation
- 6.4.4 Western Digital Corporation
- 6.4.5 Micron Technology, Inc.
- 6.4.6 SK hynix Inc.
- 6.4.7 ASTERA LABS, INC.
- 6.4.8 Kingston Technology Company, Inc.
- 6.4.9 Hewlett Packard Enterprise Company
- 6.4.10 Dell Technologies Inc.
- 6.4.11 NetApp, Inc.
- 6.4.12 Lenovo Group Limited
- 6.4.13 Huawei Technologies Co., Ltd.
- 6.4.14 Inspur Group Co., Ltd.
- 6.4.15 Pure Storage, Inc.
- 6.4.16 DataCore Software Corporation
- 6.4.17 Nutanix, Inc.
- 6.4.18 Montage Technology
- 6.4.19 AccelStor, Inc.
7 MARKET OPPORTUNITIES AND FUTURE OUTLOOK
- 7.1 White-Space and Unmet-Need Assessment

