PUBLISHER: Mordor Intelligence | PRODUCT CODE: 2044067

PUBLISHER: Mordor Intelligence | PRODUCT CODE: 2044067
Movie Theatre - Market Share Analysis, Industry Trends & Statistics, Growth Forecasts (2026 - 2031)
The movie theatre market size is projected to be USD 81.33 billion in 2025, USD 85.47 billion in 2026, and reach USD 106.71 billion by 2031, growing at a CAGR of 4.54% from 2026 to 2031.
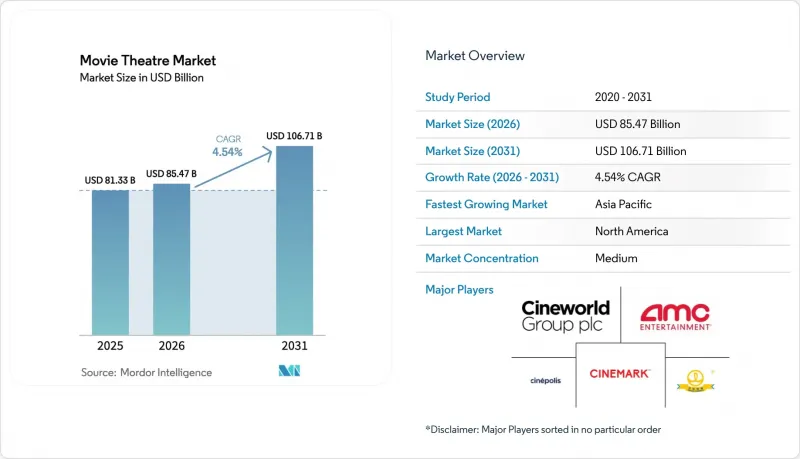
Demand is rebounding as premium-large-format (PLF) screens lift per-patron spending, while exhibitors counter streaming competition through event-driven programming and loyalty subscriptions. Operators are prioritizing capital toward immersive technologies that widen ticket price bands, although high interest charges limit smaller chains from matching upgrades. North America remains the revenue anchor but is losing relative weight to Asia-Pacific, where China and India are adding screens in tier-2 and tier-3 cities. Sovereign-backed investment in Saudi Arabia and the United Arab Emirates is accelerating regional supply, and studio pipelines returning to pre-pandemic cadence are reinforcing the box-office recovery.
Global Movie Theatre Market Trends and Insights
Proliferation of Premium Large Format and Immersive Technology
Exhibitors treat PLF as a margin-defense play rather than a novelty. CJ 4DPLEX agreed to install 115 combined 4DX and ScreenX auditoriums across AMC Entertainment and Cinepolis during 2025, extending its global footprint past 1,200 screens. In North America, PLF tickets command USD 5-8 premiums that translate into 40-60% higher revenue per seat. IMAX added four new U.S. locations with Regal and signed for 20 additional screens in Saudi Arabia and India, confirming exhibitor willingness to co-finance high-capex systems that justify elevated pricing.
Rising Disposable Incomes in Emerging Markets
Middle-class expansion is redrawing investment maps. PVR INOX added 200 franchise-and-management-contract screens in Indian cities of 100,000-500,000 residents for fiscal 2026, minimizing capital exposure while expanding its footprint. CJ CGV's Vietnam revenue climbed 42.2% year-over-year to KRW 253.6 billion (USD 190 million) as premium-format adoption spread in Ho Chi Minh City and Hanoi. These patterns indicate that emerging markets will contribute a disproportionate share of screen additions and concession growth.
Rapid Shift Toward Over-The-Top Streaming Platforms
Theatrical windows compressed to an average 45 days in 2025, with some Universal titles moving to Peacock after 17 days. Netflix, with 282.7 million subscribers as of Q3 2024, released The Electric State in March 2025 with a limited theatrical run of fewer than 500 screens, prioritizing streaming visibility over box-office revenue. This strategy fragments audience attention and conditions consumers to wait for home availability, particularly for mid-budget dramas and comedies that lack spectacle to justify a cinema visit. Exhibitors counter by emphasizing event-driven releases-films like Wicked received 90-plus-day windows in 2024 due to strong opening performance, but the structural shift toward day-and-date or shortened windows is irreversible for most titles.
Other drivers and restraints analyzed in the detailed report include:
- Recovery of Tent-Pole Blockbuster Release Schedules
- Growth Of Event Cinema Programming
- High Capital Outlays Required For Premium Technology Upgrades
For complete list of drivers and restraints, kindly check the Table Of Contents.
Segment Analysis
2D screens comprised 62.83% of 2025 revenue because of widespread availability and lower operating costs. Premium formats are expected to capture incremental share as ScreenX and other PLF formats advance at a 4.61% CAGR to 2031, reflecting exhibitor focus on per-patron yield. IMAX, holding roughly 5% of screens, delivers ticket premiums of USD 5-8 above base prices and maintains strong occupancy, underscoring its moat against home theater substitution.
ScreenX installations, costing USD 300,000-500,000 each, provide a lower-capex entry point for mid-tier exhibitors, while 4DX appeals to 18-34 demographics seeking heightened immersion. CJ 4DPLEX's 2025 box office of USD 458 million verifies monetization effectiveness. The screen-format mix illustrates how the movie theatre market size evolves through technology segmentation rather than pure volume expansion.
Multiplexes delivered 56.91% of total revenue in 2025 by leveraging eight-to-16-screen footprints that maximize showtime flexibility and concession throughput. In contrast, luxury boutique venues are growing at a 4.66% CAGR, attracting affluent patrons willing to pay USD 25-40 per ticket for recliners, gourmet menus, and 21-plus environments. Single-screen independents continue to shutter due to capital constraints, although art-house outlets in urban centers survive through community programming.
Sony Pictures' 2024 acquisition of Alamo Drafthouse illustrates how content owners value boutique chains for controlled distribution and premium economics. Open-air and pop-up venues serve seasonal demand in Australia and the Middle East, but drive-ins that boomed during 2020 social distancing are plateauing as indoor venues resume normal capacity. Theatre-type bifurcation underscores segmentation of willingness-to-pay within the broader movie theatre market.
The Movie Theatre Market is Segmented by Screen Format (2D, 3D, IMAX, and More), Theatre Type (Multiplex, Single-Screen Independent, Drive-In, Luxury Boutique, and More), Revenue Stream (Ticket Sales, Concessions and Food and Beverage, On-Screen Advertising, and More), Ownership Model (Publicly Traded Chains, Private Chains, Independent Owners, and More), and Geography. The Market Forecasts are Provided in Terms of Value (USD).
Geography Analysis
North America accounted for 45.38% of 2025 global revenue, driven by the highest average ticket prices and robust concession spending. Box-office recovery to USD 9 billion reflects resilient demand for tent-poles, yet per-capita attendance trails 2019 levels as streaming entrenches at-home viewing. Chapter 11 exits by AMC Entertainment and Cineworld closed underperforming sites, tightening supply and lifting utilization. Canada's Cineplex contends with rising labor costs, while Mexico gains from Cinepolis' expansion into lower-rent tier-2 cities.
Asia-Pacific is forecast to grow at 4.70% through 2031, the fastest regional pace. China's screen count reached 90,968 in 2024, and box office climbed to CNY 48 billion (USD 6.78 billion) in 2025 despite domestic-film quotas limiting foreign titles. India's PVR INOX added franchise screens in secondary cities, keeping average ticket price at Rs 260 (USD 3.12) while lifting food and beverage revenue per patron. Southeast Asian growth is anchored by CJ CGV's Vietnamese operations, which rose 42.2% in fiscal 2025, demonstrating middle-class buying power.
Europe remains fragmented. Western markets such as the United Kingdom and Germany face attendance declines amid intense OTT penetration, whereas Eastern markets expand from lower bases. Kinepolis' EUR 242.8 million (USD 274 million) Q3 2024 revenue highlights selective growth via premium formats. Green-building mandates under the EU EPBD raise real-estate costs by 15-25%, favoring chains with stronger balance sheets. The Middle East surges on sovereign funding, VOX Cinemas pledged SAR 2 billion (USD 533 million) to install 600 Saudi screens by 2028, signaling state-driven capacity creation.
- AMC Entertainment Holdings Inc.
- Cineworld Group plc
- Cinemark Holdings Inc.
- CJ CGV Co., Ltd.
- Cineplex Inc.
- Cinepolis de Mexico S.A. de C.V.
- Regal Entertainment Group
- Vue International Bidco plc
- Wanda Film Holding Co., Ltd.
- PVR INOX Limited
- Kinepolis Group NV
- National Amusements, Inc.
- B and B Theatres, Inc.
- Pathe Theatres B.V.
- VOX Cinemas (Majid Al Futtaim Cinemas LLC)
- Harkins Theatres, Inc.
- Golden Screen Cinemas Sdn Bhd
- Event Hospitality and Entertainment Ltd.
- The HOYTS Group Pty Ltd
- Ster-Kinekor Theatres Pty Ltd
- IMAX Corporation
Additional Benefits:
- The market estimate (ME) sheet in Excel format
- 3 months of analyst support
TABLE OF CONTENTS
1 INTRODUCTION
- 1.1 Study Assumptions and Market Definition
- 1.2 Scope of the Study
2 RESEARCH METHODOLOGY
3 EXECUTIVE SUMMARY
4 MARKET LANDSCAPE
- 4.1 Market Overview
- 4.2 Market Drivers
- 4.2.1 Proliferation of Premium Large Format (PLF) and Immersive Technologies
- 4.2.2 Rising Disposable Incomes in Emerging Markets
- 4.2.3 Recovery of Tent-Pole Blockbuster Release Schedules
- 4.2.4 Growth of Event Cinema Programming
- 4.2.5 AI-Driven Showtime and Content Mix Optimization
- 4.2.6 Blockchain-Based Loyalty Tokens and Micro-Rewards
- 4.3 Market Restraints
- 4.3.1 Rapid Shift Toward Over-the-Top (OTT) Streaming Platforms
- 4.3.2 High Capital Outlays Required for Premium Technology Upgrades
- 4.3.3 Escalating Insurance Premiums for Venue Security and Health Protocols
- 4.3.4 Tightening Green-Building Finance Rules Raising Cinema Real-Estate Costs
- 4.4 Value Chain Analysis
- 4.5 Regulatory Landscape
- 4.6 Porter's Five Forces Analysis
- 4.6.1 Bargaining Power of Buyers
- 4.6.2 Bargaining Power of Suppliers
- 4.6.3 Threat of New Entrants
- 4.6.4 Threat of Substitutes
- 4.6.5 Intensity of Competitive Rivalry
- 4.7 Impact of Macroeconomic Trends on the Market
5 MARKET SIZE AND GROWTH FORECASTS (VALUE)
- 5.1 By Screen Format
- 5.1.1 2D
- 5.1.2 3D
- 5.1.3 IMAX
- 5.1.4 4DX
- 5.1.5 ScreenX and Other PLF
- 5.2 By Theatre Type
- 5.2.1 Multiplex
- 5.2.2 Single-Screen Independent
- 5.2.3 Drive-In
- 5.2.4 Luxury Boutique
- 5.2.5 Open-Air / Pop-Up
- 5.3 By Revenue Stream
- 5.3.1 Ticket Sales
- 5.3.2 Concessions and Food and Beverage
- 5.3.3 On-Screen Advertising
- 5.3.4 Event Cinema and Venue Rental
- 5.3.5 Subscription and Loyalty Programs
- 5.4 By Ownership Model
- 5.4.1 Publicly Traded Chains
- 5.4.2 Private Chains
- 5.4.3 Independent Owners
- 5.4.4 Government / Non-Profit Operators
- 5.5 By Geography
- 5.5.1 North America
- 5.5.1.1 United States
- 5.5.1.2 Canada
- 5.5.1.3 Mexico
- 5.5.2 South America
- 5.5.2.1 Brazil
- 5.5.2.2 Argentina
- 5.5.2.3 Rest of South America
- 5.5.3 Europe
- 5.5.3.1 United Kingdom
- 5.5.3.2 Germany
- 5.5.3.3 France
- 5.5.3.4 Italy
- 5.5.3.5 Spain
- 5.5.3.6 Rest of Europe
- 5.5.4 Asia-Pacific
- 5.5.4.1 China
- 5.5.4.2 India
- 5.5.4.3 Japan
- 5.5.4.4 South Korea
- 5.5.4.5 Australia
- 5.5.4.6 Rest of Asia-Pacific
- 5.5.5 Middle East
- 5.5.5.1 Saudi Arabia
- 5.5.5.2 United Arab Emirates
- 5.5.5.3 Rest of Middle East
- 5.5.6 Africa
- 5.5.6.1 South Africa
- 5.5.6.2 Egypt
- 5.5.6.3 Rest of Africa
- 5.5.1 North America
6 COMPETITIVE LANDSCAPE
- 6.1 Market Concentration
- 6.2 Strategic Moves
- 6.3 Market Share Analysis
- 6.4 Company Profiles (includes Global Level Overview, Market Level Overview, Core Segments, Financials as available, Strategic Information, Market Rank/Share, Products and Services, Recent Developments)
- 6.4.1 AMC Entertainment Holdings Inc.
- 6.4.2 Cineworld Group plc
- 6.4.3 Cinemark Holdings Inc.
- 6.4.4 CJ CGV Co., Ltd.
- 6.4.5 Cineplex Inc.
- 6.4.6 Cinepolis de Mexico S.A. de C.V.
- 6.4.7 Regal Entertainment Group
- 6.4.8 Vue International Bidco plc
- 6.4.9 Wanda Film Holding Co., Ltd.
- 6.4.10 PVR INOX Limited
- 6.4.11 Kinepolis Group NV
- 6.4.12 National Amusements, Inc.
- 6.4.13 B and B Theatres, Inc.
- 6.4.14 Pathe Theatres B.V.
- 6.4.15 VOX Cinemas (Majid Al Futtaim Cinemas LLC)
- 6.4.16 Harkins Theatres, Inc.
- 6.4.17 Golden Screen Cinemas Sdn Bhd
- 6.4.18 Event Hospitality and Entertainment Ltd.
- 6.4.19 The HOYTS Group Pty Ltd
- 6.4.20 Ster-Kinekor Theatres Pty Ltd
- 6.4.21 IMAX Corporation
7 MARKET OPPORTUNITIES AND FUTURE OUTLOOK
- 7.1 White-Space and Unmet-Need Assessment

