
PUBLISHER: Mordor Intelligence | PRODUCT CODE: 2044087

PUBLISHER: Mordor Intelligence | PRODUCT CODE: 2044087
Interactive Display - Market Share Analysis, Industry Trends & Statistics, Growth Forecasts (2026 - 2031)
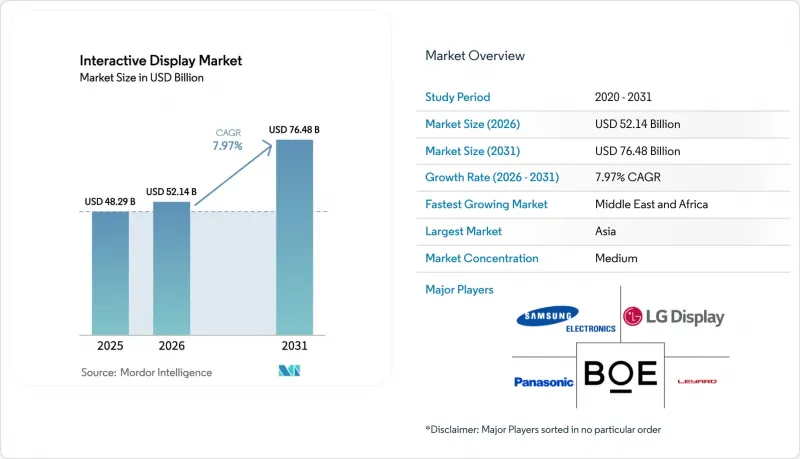
The Interactive Display Market size is expected to increase from USD 48.29 billion in 2025 to USD 52.14 billion in 2026 and reach USD 76.48 billion by 2031, growing at a CAGR of 7.97% over 2026-2031.
Growth is underpinned by hybrid work adoption, smart-city roll-outs, and steady advances in touch-sensing that make digital surfaces more responsive, brighter, and energy-efficient. Education, corporate collaboration, and public-facing self-service remain the largest revenue pools, yet healthcare way-finding and transport passenger-information systems are adding fresh demand streams. Consolidation among panel makers, especially in China, is shifting bargaining power along the supply chain and giving buyers access to larger, higher-resolution screens at lower unit cost. At the same time, energy-driven increases in glass pricing, plus fragile semiconductor supplies, are nudging total cost of ownership higher, steering some buyers toward vendors that bundle lifecycle services with hardware.
Global Interactive Display Market Trends and Insights
Growing Adoption of Interactive Flat Panels in Hybrid Classrooms Across North America
School districts that received federal technology grants are replacing whiteboards with touch-enabled panels to keep remote and in-class learners on the same page. Seamless switching between cloud learning platforms and classroom resources makes the panels the centerpiece of lesson delivery. SMART Technologies' India expansion signals how producers now localize hardware and content for broader curricula, lowering procurement friction for budget-sensitive institutions. These education deployments lengthen replacement cycles and lock in software subscriptions-effects that lift lifetime revenue for vendors.
Retail Demand for Self-Service Interactive Kiosks Accelerating in Europe
Labor shortages and consumer preference for contact-free check-out are pushing European retailers to install kiosks that handle ordering, payments, survey capture, and loyalty enrollment around the clock. Kiosks' multilingual menus widen customer reach without extra staffing. Hospitality operators use the same hardware for upselling room upgrades and local experiences, demonstrating the cross-sector usefulness of touch-based self-service.
High Total Cost of Ownership for Large-Format Interactive Walls in Emerging Economies
Hardware expenses only account for half of a multi-panel wall over five years; installation, software, and service double the bill. May 2025 capacity cuts among panel makers show vendors protecting margins amid tariff uncertainty, limiting discount room for buyers. Currency swings also raise landed costs where budgets are pegged to local tenders, slowing adoption in schools and offices outside the OECD.
Other drivers and restraints analyzed in the detailed report include:
- Corporate Digital Collaboration Needs Driving Interactive Video Walls in Asia-Pacific Headquarters
- Government Smart-City Initiatives Boosting Outdoor Interactive Displays in the Middle East
- Supply-Chain Constraints of Semiconductor ICs Affecting Touch-Controller Availability
For complete list of drivers and restraints, kindly check the Table Of Contents.
Segment Analysis
Interactive flat panels generated 87.45% of revenue in 2025 and remain the default choice for classrooms, meeting rooms, and retail huddle zones thanks to wall-mount simplicity and familiar user interfaces. Vendors bundle whiteboard, video-conferencing, and device-casting apps to minimize training time, turning the hardware into a turnkey collaboration hub that justifies premium service contracts. As educators require seamless transitions between on-site and remote lessons, the panels' role as backbone infrastructure strengthens budget priority.
Interactive kiosks constitute the speediest niche at an 8.28% CAGR, powered by hospitality self-check-in and quick-service restaurant ordering. Meanwhile, video walls address data-rich settings such as security command centers, and interactive tables gain a foothold in museums and design studios where multiple users work simultaneously on horizontal layouts. Mirrors and other emerging forms unlock virtual try-on and architectural signage, expanding where and how the interactive display market appears in physical spaces.
LCD accounted for 61.22% revenue in 2025, leveraging economies of scale and a well-established supplier ecosystem. Nevertheless, direct-view LED's 9.34% CAGR reflects buyer appetite for bezel-free canvases, higher brightness, and lower operating cost. OLED stays a premium option where contrast and color fidelity trump price, notably in studio and luxury retail.
Projection and DLP still serve extra-large auditoria, yet lamp replacement and ambient-light sensitivity curb long-run competitiveness. Research into perovskite LEDs hints at thinner, cheaper, and integrated touch possibilities that could re-shape the interactive display market over the next decade.
The Interactive Display Market Report is Segmented by Display Type (Interactive Kiosk, Interactive Video Wall, and More), Technology (LCD, OLED, and More), Touch-Sensing Technology (Infrared, Capacitive, and More), Panel Size (Up To 32", 32" - 65", and Above 65"), Panel Orientation (Landscape, and Portrait), End-User Vertical (Education, and More), and Geography. The Market Forecasts are Provided in Terms of Value USD.
Geography Analysis
Asia-Pacific generated 32.85% of 2025 revenue, supported by integrated supply chains and aggressive capacity expansions such as BOE's USD 9 billion Gen-8.6 AMOLED plant in Chengdu. Japan and South Korea add patented process know-how, while India's incentives for local assembly are drawing global brands to in-country partnerships. Growing domestic consumption across classrooms and corporate campuses further anchors the interactive display market in the region.
North America stays influential on the back of hybrid-work software and cloud ecosystems that depend on touch-enabled surfaces for brainstorming and analytics. Federal and provincial grants keep schools refreshing AV gear, and U.S. enterprises remain early buyers of novel collaboration features. Supply-chain resilience is a priority, prompting some panel makers to diversify beyond Asia in line with reshoring policies.
Europe emphasizes self-service, green operations, and healthcare digitalization. Retailers deploy kiosks to cope with staffing shortages, while Nordic hospitals pioneer way-finding interfaces that cut check-in congestion. Strict energy codes also push buyers toward low-power LED models.
The Middle East and Africa lead growth at 9.55% CAGR to 2031, fueled by multibillion-dollar smart-city programs that embed interactive screens into transit shelters, cultural districts, and e-government counters. Harsh climate prompts high-brightness, sealed enclosures, creating premium margin potential for vendors with rugged options.
South America is on an infrastructure modernizing curve where airports and metros rely on passenger-information displays to streamline traffic and revenue. Urbanization and tourism lift municipal budgets for such upgrades, though currency volatility can delay orders.
- Samsung Electronics Co., Ltd.
- LG Display Co., Ltd.
- BOE Technology Group Co., Ltd.
- Panasonic Corporation
- Leyard Optoelectronic Co., Ltd.
- Sharp NEC Display Solutions, Ltd.
- ViewSonic Corporation
- Planar Systems, Inc.
- SMART Technologies ULC
- Promethean World Ltd.
- Newline Interactive, Inc.
- Elo Touch Solutions, Inc.
- BenQ Corporation
- Delta Electronics, Inc. (Vivitek)
- Christie Digital Systems USA, Inc.
- AU Optronics Corp.
- Advantech Co., Ltd.
- Boxlight Corporation
- Horizon Display, Inc.
- Baanto International Ltd.
- Intuiface (IntuiLab SAS)
- CLEVERTOUCH (Boxlight)
- Kiosk Information Systems
- GestureTek Systems, Inc.
- KT Corporation (Digico)
Additional Benefits:
- The market estimate (ME) sheet in Excel format
- 3 months of analyst support
TABLE OF CONTENTS
1 INTRODUCTION
- 1.1 Study Assumptions and Market Definition
- 1.2 Scope of the Study
2 RESEARCH METHODOLOGY
3 EXECUTIVE SUMMARY
4 MARKET LANDSCAPE
- 4.1 Market Overview
- 4.2 Market Drivers
- 4.2.1 Growing Adoption of Interactive Flat Panels in Hybrid Classrooms Across North America
- 4.2.2 Retail Demand for Self-Service Interactive Kiosks Accelerating in Europe
- 4.2.3 Corporate Digital Collaboration Needs Driving Interactive Video Walls in Asia-Pacific Headquarters
- 4.2.4 Government Smart-City Initiatives Boosting Outdoor Interactive Displays in the Middle East
- 4.2.5 Increasing Deployment of Interactive Passenger Information Displays in Transportation Hubs Across South America
- 4.2.6 Surge in Interactive Way-finding Solutions within Healthcare Facilities in Nordic Countries
- 4.3 Market Restraints
- 4.3.1 High Total Cost of Ownership for Large-Format Interactive Walls in Emerging Economies
- 4.3.2 Supply-Chain Constraints of Semiconductor ICs Affecting Touch-Controller Availability
- 4.3.3 Health and Hygiene Concerns over Public Touchscreens Post-COVID in the Caribbeans and Africa
- 4.3.4 Integration Complexity with Legacy AV/IT Infrastructure in BFSI Sector
- 4.4 Industry Ecosystem Analysis
- 4.5 Technological Outlook
- 4.6 Porter's Five Forces Analysis
- 4.6.1 Bargaining Power of Suppliers
- 4.6.2 Bargaining Power of Buyers
- 4.6.3 Threat of New Entrants
- 4.6.4 Threat of Substitutes
- 4.6.5 Intensity of Competitive Rivalry
5 MARKET SIZE AND GROWTH FORECASTS (VALUES)
- 5.1 By Display Type
- 5.1.1 Interactive Kiosk
- 5.1.2 Interactive Video Wall
- 5.1.3 Interactive Whiteboard
- 5.1.4 Interactive Flat Panel
- 5.1.5 Interactive Table
- 5.1.6 Interactive Mirror
- 5.1.7 Other Display Types
- 5.2 By Technology
- 5.2.1 LCD
- 5.2.2 LED (Direct-View)
- 5.2.3 OLED
- 5.2.4 Projection and DLP
- 5.2.5 ePaper and Other Emerging
- 5.3 By Touch-Sensing Technology
- 5.3.1 Infrared
- 5.3.2 capacitive
- 5.3.3 Resistive
- 5.3.4 Optical Imaging
- 5.3.5 Acoustic Wave and Others
- 5.4 By Panel Size
- 5.4.1 Up to 32"
- 5.4.2 32" - 65"
- 5.4.3 Above 65"
- 5.5 By Panel Orientation
- 5.5.1 Landscape
- 5.5.2 Portrait
- 5.6 By End-user Vertical
- 5.6.1 Education
- 5.6.2 Corporate and Enterprise
- 5.6.3 Retail and Hospitality
- 5.6.4 Transportation and Logistics
- 5.6.5 Healthcare
- 5.6.6 Banking, Financial Services and Insurance (BFSI)
- 5.6.7 Industrial and Manufacturing
- 5.6.8 Sports and Entertainment Venues
- 5.6.9 Government and Defense
- 5.6.10 Other Verticals
- 5.7 By Geography
- 5.7.1 North America
- 5.7.1.1 United States
- 5.7.1.2 Canada
- 5.7.1.3 Mexico
- 5.7.2 Europe
- 5.7.2.1 Germany
- 5.7.2.2 United Kingdom
- 5.7.2.3 France
- 5.7.2.4 Nordics
- 5.7.2.5 Rest of Europe
- 5.7.3 South America
- 5.7.3.1 Brazil
- 5.7.3.2 Rest of South America
- 5.7.4 Asia Pacific
- 5.7.4.1 China
- 5.7.4.2 Japan
- 5.7.4.3 India
- 5.7.4.4 South East Asia
- 5.7.4.5 Rest of Asia Pacific
- 5.7.5 Middle East and Africa
- 5.7.5.1 Middle East
- 5.7.5.1.1 Gulf Cooperation Council Countries
- 5.7.5.1.2 Turkey
- 5.7.5.1.3 Rest of Middle East
- 5.7.5.2 Africa
- 5.7.5.2.1 South Africa
- 5.7.5.2.2 Rest of Africa
- 5.7.5.1 Middle East
- 5.7.1 North America
6 COMPETITIVE LANDSCAPE
- 6.1 Market Concentration
- 6.2 Strategic Moves
- 6.3 Market Share Analysis
- 6.4 Company Profiles {(includes Global-level Overview, Market-level Overview, Core Segments, Financials as available, Strategic Information, Market Rank/Share, Products and Services, Recent Developments)}
- 6.4.1 Samsung Electronics Co., Ltd.
- 6.4.2 LG Display Co., Ltd.
- 6.4.3 BOE Technology Group Co., Ltd.
- 6.4.4 Panasonic Corporation
- 6.4.5 Leyard Optoelectronic Co., Ltd.
- 6.4.6 Sharp NEC Display Solutions, Ltd.
- 6.4.7 ViewSonic Corporation
- 6.4.8 Planar Systems, Inc.
- 6.4.9 SMART Technologies ULC
- 6.4.10 Promethean World Ltd.
- 6.4.11 Newline Interactive, Inc.
- 6.4.12 Elo Touch Solutions, Inc.
- 6.4.13 BenQ Corporation
- 6.4.14 Delta Electronics, Inc. (Vivitek)
- 6.4.15 Christie Digital Systems USA, Inc.
- 6.4.16 AU Optronics Corp.
- 6.4.17 Advantech Co., Ltd.
- 6.4.18 Boxlight Corporation
- 6.4.19 Horizon Display, Inc.
- 6.4.20 Baanto International Ltd.
- 6.4.21 Intuiface (IntuiLab SAS)
- 6.4.22 CLEVERTOUCH (Boxlight)
- 6.4.23 Kiosk Information Systems
- 6.4.24 GestureTek Systems, Inc.
- 6.4.25 KT Corporation (Digico)
7 MARKET OPPORTUNITIES AND FUTURE OUTLOOK
- 7.1 White-space and Unmet-Need Assessment

