
PUBLISHER: Mordor Intelligence | PRODUCT CODE: 2044090

PUBLISHER: Mordor Intelligence | PRODUCT CODE: 2044090
Space Technology - Market Share Analysis, Industry Trends & Statistics, Growth Forecasts (2026 - 2031)
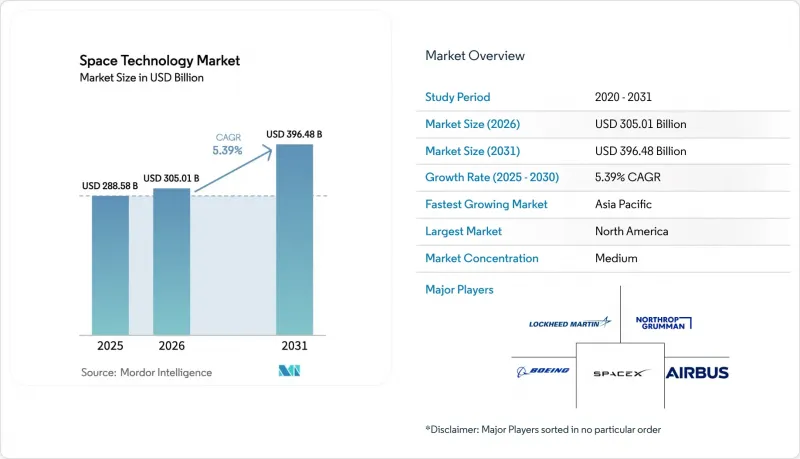
The space technology market size is projected to expand from USD 288.58 billion in 2025 and USD 305.01 billion in 2026 to USD 396.48 billion by 2031, registering a CAGR of 5.39% between 2026 and 2031.
Commercial operators are reshaping what was once a government-centric domain, channelling private capital toward low Earth orbit (LEO) broadband constellations, in-orbit servicing, and space tourism. Reusable launch systems are compressing per-kilogram pricing, software-defined satellites are displacing fixed payloads, and national-security buyers are procuring resilient proliferated constellations instead of a handful of exquisite craft. Operators that align capital spending with these shifts are finding new revenue streams even as regulatory oversight around debris mitigation, export controls, and launch licensing tightens.
Global Space Technology Market Trends and Insights
Rapidly Falling Launch Costs Via Reusable Vehicles
Falcon 9 first stages completed 23 reflights in 2025, lowering marginal launch prices to roughly USD 28 million per mission and proving that hardware can survive repeated entry and landing cycles without major refurbishment. Rocket Lab introduced helicopter-assisted booster recovery in 2024, cutting refurbishment time below 30 days and giving small-satellite operators the cadence they need. Blue Origin's New Glenn, awarded seven national-security launches, is designed for 25 flights and targets sub-USD 50 million pricing per heavy mission. Cost compression frees capital for satellite replenishment, making frequent refresh cycles economical and shortening design-to-orbit timelines.
Rising Government Investments in Space Programs
NASA's FY 2026 appropriation rose 7% to USD 27.2 billion, funding Artemis lunar logistics, earth-science missions, and commercial crew contracts. The European Space Agency (ESA) secured a 17% uplift to EUR 17.5 billion (USD 19.8 billion) through 2027, ring-fencing funds for Ariane 6 flights, the IRIS2 secure-communications constellation, and zero-debris initiatives. India boosted its Department of Space budget 12% to INR 130 billion (USD 1.56 billion) to finance the Gaganyaan crewed flight and open launch licenses to private firms. State spending is no longer solely science-driven; it now anchors commercial broadband, climate monitoring, and defense-grade surveillance.
Orbital Debris, Congestion, And Space-Traffic Management Gaps
The FCC shortened permissible deorbit time from 25 years to 5 years for U.S.-licensed craft, but enforcement abroad is patchy, leading to asymmetric compliance. ESA's voluntary Zero Debris Charter seeks debris-neutral missions by 2030, yet funding for active removal remains uncertain. Astroscale's COSMIC mission will attempt magnetic docking and controlled re-entry in 2026; success could set cost benchmarks for compulsory cleanup. Operators report rising avoidance manoeuvres in sun-synchronous bands, burning propellant and shortening service life.
Other drivers and restraints analyzed in the detailed report include:
- Miniaturization Enabling Affordable Satellite Constellations
- National-Security Focus on Resilient Space Architectures
- High Up-Front CAPEX And R&D Expenditure
For complete list of drivers and restraints, kindly check the Table Of Contents.
Segment Analysis
Payload equipment is on track to outgrow every other subsystem at a 6.17% CAGR. Operators favour reconfigurable transponders that can shift spectrum or beam patterns in orbit, mitigating market-demand uncertainty and supporting incremental revenue streams. Launch vehicle hardware, despite holding 31.28% of 2025 revenue, faces margin pressure as reusable rockets standardize low pricing. Orbit segment ground networks are pivoting to cloud-hosted antenna-as-a-service, while new spaceports in Scotland and Oman aim to capture regional demand. Software-defined satellites integrate optical links and on-board processing, making them the focal point of capital spending.
The transition boosts the space technology market size for payloads relative to boosters while lifting the space technology market share of firms that supply software-defined electronics. Optical inter-satellite link providers, 3D-printed RF-component manufacturers, and on-board AI-chip designers are scaling to meet order books that stretch into the latter half of the decade.
Commercial customers already account for nearly half of market revenue and are growing faster than civil agencies and militaries. Direct-to-device broadband, subscription earth-imaging, and cloud relay services give enterprises predictable recurring income streams, supporting private financing in lieu of single government anchor contracts. Defense agencies remain critical in absolute dollars yet increasingly outsource launches and hosted payloads to commercial providers for schedule certainty.
Consequently, the space technology market size tied to commercial activity is rising faster than government programs, and companies capturing that demand are widening their space technology market share through service bundling launch, satellite, ground segment, and analytics under one contract.
The Space Technology Market Report is Segmented by Subsystem (Orbit Segment, Launch Platform, and Launch Vehicle, Payload), End-Use (Civil, Commercial, and Military and Intelligence), Application (Communication, Earth Observation, Navigation and Positioning, Space Exploration, and More), Orbit Type (LEO, MEO, and More), and Geography. The Market Forecasts are Provided in Terms of Value (USD).
Geography Analysis
North America retains leadership on the strength of Pentagon launch contracts, NASA spending, and deep venture pools clustered in California, Colorado, and Florida. Regulatory agencies, notably the FCC and FAA, shape deployment cadences through orbital-debris and launch-safety rules. Canada partners on lunar Gateway modules and invests in SAR constellations, while Mexico advances its first domestically built satellite in collaboration with academic institutions.
Asia-Pacific delivers the highest regional CAGR as India liberalizes commercial launches and China executes the world's busiest manifest. Japan's H3 rocket returns to flight with UAE and domestic contracts, South Korea's Nuri program builds sovereign lift capacity, and Southeast Asian nations fund pad facilities and ground segments. Middle Eastern governments, led by the UAE and Saudi Arabia, inject multi-billion-dollar budgets to diversify economies and cultivate indigenous satellite manufacturing.
Europe's Ariane 6 restores autonomous heavy-lift capacity, and the forthcoming IRIS2 constellation underscores the continent's push for strategic independence. United Kingdom certification of SaxaVord Spaceport opens polar-orbit opportunities, while ESA's zero-debris initiatives influence design rules across member states. Africa and South America remain smaller but invest in ground infrastructure and rideshare missions to support agriculture and forestry monitoring.
- Airbus SE
- Ball Corporation
- Boeing Defense, Space and Security
- China Aerospace Science and Technology Corp. (CASC)
- Lockheed Martin Corp.
- Northrop Grumman Corp.
- Space Exploration Technologies Corp. (SpaceX)
- Thales Group
- Viasat, Inc.
- Intelsat SA
- Safran SA
- Honeywell International Inc.
- SES S.A.
- L3Harris Technologies, Inc.
- Rocket Lab USA, Inc.
- Blue Origin, LLC
- Mitsubishi Heavy Industries, Ltd.
- Maxar Technologies Inc.
- Sierra Space Corp.
- Relativity Space, Inc.
- Astroscale Holdings Inc.
- Planet Labs PBC
- OneWeb Ltd.
Additional Benefits:
- The market estimate (ME) sheet in Excel format
- 3 months of analyst support
TABLE OF CONTENTS
1 INTRODUCTION
- 1.1 Study Assumptions and Market Definition
- 1.2 Scope of the Study
2 RESEARCH METHODOLOGY
3 EXECUTIVE SUMMARY
4 MARKET LANDSCAPE
- 4.1 Market Overview
- 4.2 Market Drivers
- 4.2.1 Rising Government Investments in Space Programs
- 4.2.2 Miniaturization Enabling Affordable Satellite Constellations
- 4.2.3 Growing Demand for High-Throughput Satellite Broadband
- 4.2.4 Commercialization of Space Tourism and In-Orbit Services
- 4.2.5 National-Security Focus on Resilient Space Architectures
- 4.2.6 Rapidly Falling Launch Costs via Reusable Vehicles
- 4.3 Market Restraints
- 4.3.1 High Up-Front CAPEX and R&D Expenditure
- 4.3.2 Orbital Debris, Congestion, and Space-Traffic Management Gaps
- 4.3.3 Regulatory Bottlenecks and ITAR Export Controls
- 4.3.4 Limited Launch Window and Pad Capacity
- 4.4 Industry Value-Chain Analysis
- 4.5 Regulatory Landscape
- 4.6 Technological Outlook
- 4.7 Porter's Five Forces Analysis
- 4.7.1 Bargaining Power of Suppliers
- 4.7.2 Bargaining Power of Buyers
- 4.7.3 Threat of New Entrants
- 4.7.4 Threat of Substitutes
- 4.7.5 Competitive Rivalry
- 4.8 Impact of Macroeconomic Factors on the Market
- 4.9 Investment Analysis
- 4.10 Key Use Cases and Case Studies
5 MARKET SIZE AND GROWTH FORECASTS (VALUE)
- 5.1 By Subsystem
- 5.1.1 Orbit Segment
- 5.1.2 Launch Platform
- 5.1.3 Launch Vehicle
- 5.1.4 Payload
- 5.2 By End-Use
- 5.2.1 Civil (Government Space Agencies)
- 5.2.2 Commercial
- 5.2.3 Military and Intelligence
- 5.3 By Application
- 5.3.1 Communication
- 5.3.2 Earth Observation
- 5.3.3 Navigation and Positioning
- 5.3.4 Space Exploration / Science Missions
- 5.3.5 Space Tourism and In-Orbit Services
- 5.4 By Orbit Type
- 5.4.1 Low Earth Orbit (LEO)
- 5.4.2 Medium Earth Orbit (MEO)
- 5.4.3 Geostationary Orbit (GEO)
- 5.4.4 Highly Elliptical and Beyond GEO
- 5.5 By Geography
- 5.5.1 North America
- 5.5.1.1 United States
- 5.5.1.2 Canada
- 5.5.1.3 Mexico
- 5.5.2 South America
- 5.5.2.1 Brazil
- 5.5.2.2 Argentina
- 5.5.2.3 Rest of South America
- 5.5.3 Europe
- 5.5.3.1 United Kingdom
- 5.5.3.2 Germany
- 5.5.3.3 France
- 5.5.3.4 Italy
- 5.5.3.5 Spain
- 5.5.3.6 Nordics
- 5.5.3.7 Rest of Europe
- 5.5.4 Middle East
- 5.5.4.1 Saudi Arabia
- 5.5.4.2 United Arab Emirates
- 5.5.4.3 Turkey
- 5.5.4.4 Rest of Middle East
- 5.5.5 Africa
- 5.5.5.1 South Africa
- 5.5.5.2 Egypt
- 5.5.5.3 Nigeria
- 5.5.5.4 Rest of Africa
- 5.5.6 Asia-Pacific
- 5.5.6.1 China
- 5.5.6.2 India
- 5.5.6.3 Japan
- 5.5.6.4 South Korea
- 5.5.6.5 ASEAN
- 5.5.6.6 Australia
- 5.5.6.7 New Zealand
- 5.5.6.8 Rest of Asia-Pacific
- 5.5.1 North America
6 COMPETITIVE LANDSCAPE
- 6.1 Market Concentration
- 6.2 Strategic Moves
- 6.3 Market Share Analysis
- 6.4 Company Profiles (includes Global Level Overview, Market Level Overview, Core Segments, Financials as available, Strategic Information, Market Rank/Share, Products and Services, Recent Developments)
- 6.4.1 Airbus SE
- 6.4.2 Ball Corporation
- 6.4.3 Boeing Defense, Space and Security
- 6.4.4 China Aerospace Science and Technology Corp. (CASC)
- 6.4.5 Lockheed Martin Corp.
- 6.4.6 Northrop Grumman Corp.
- 6.4.7 Space Exploration Technologies Corp. (SpaceX)
- 6.4.8 Thales Group
- 6.4.9 Viasat, Inc.
- 6.4.10 Intelsat SA
- 6.4.11 Safran SA
- 6.4.12 Honeywell International Inc.
- 6.4.13 SES S.A.
- 6.4.14 L3Harris Technologies, Inc.
- 6.4.15 Rocket Lab USA, Inc.
- 6.4.16 Blue Origin, LLC
- 6.4.17 Mitsubishi Heavy Industries, Ltd.
- 6.4.18 Maxar Technologies Inc.
- 6.4.19 Sierra Space Corp.
- 6.4.20 Relativity Space, Inc.
- 6.4.21 Astroscale Holdings Inc.
- 6.4.22 Planet Labs PBC
- 6.4.23 OneWeb Ltd.
7 MARKET OPPORTUNITIES AND FUTURE OUTLOOK
- 7.1 White-Space and Unmet-Need Assessment

