
PUBLISHER: Mordor Intelligence | PRODUCT CODE: 2044112

PUBLISHER: Mordor Intelligence | PRODUCT CODE: 2044112
Europe Polyethylene Terephthalate (PET) - Market Share Analysis, Industry Trends & Statistics, Growth Forecasts (2026 - 2031)
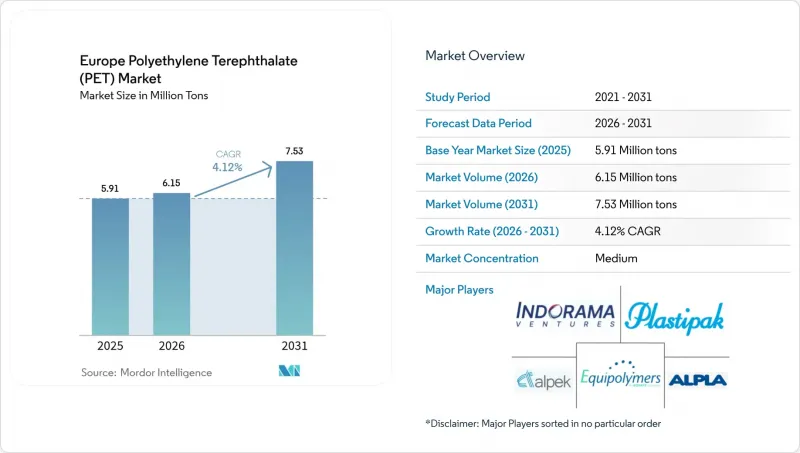
The European Polyethylene Terephthalate Market size is expected to increase from 5.91 million tons in 2025 to 6.15 million tons in 2026 and reach 7.53 million tons by 2031, growing at a CAGR of 4.12% over 2026-2031.
Virgin resin remains dominant, but mandates for recycled content in beverage bottles and a broader deposit-return-scheme coverage are altering procurement decisions. This evolution heightens the demand's responsiveness to collection system efficiencies. Investments in mechanical and chemical recycling, which became operational in 2024 and 2025, have narrowed the price gap between virgin resin and recycled PET (rPET). However, policy incentives for biorecycled plastics have alleviated any remaining cost premium. Even as energy prices have kept European production costs high since 2021, imports from Turkey, Egypt, and Vietnam are squeezing regional margins. Additionally, global beverage brands' lightweighting strategies are changing the resin demand dynamics. These strategies benefit converters skilled in precision molding but simultaneously hinder overall packaging volume growth.
Europe Polyethylene Terephthalate (PET) Market Trends and Insights
EU Single-Use Plastics Directive Mandates 25% rPET in Beverage Bottles
Brand owners now face a mandate, as the directive transforms recycled content from a cost consideration into a compliance requirement. This shift compels them to secure multi-year offtake contracts, which reduces spot-market liquidity. Furthermore, until 2027, the directive provides a tariff-equivalent advantage for EU recyclers, as rPET processed outside the EU does not contribute to compliance targets. This policy channels investments into European facilities. In February 2026, Loop Industries strategically selected BASF's Schwarzheide site, highlighting the directive's impact.
Deposit-Return-Scheme Expansion Boosts PET Bale Quality and Volumes
Germany's high return rate ensures bales remain largely uncontaminated, facilitating direct bottle-to-bottle recycling with minimal reprocessing. In its inaugural operational year, Ireland's impressive container deposit figures underscore the impact of well-calibrated deposit values on consumer choices. On the other hand, the United Kingdom's postponement to 2027 keeps it dependent on curbside streams, which face contamination issues, restricting the supply of food-grade rPET.
Low-Cost PET Imports from Turkey, Egypt, and Vietnam Squeeze EU Producer Margins
In 2025, Turkey was the largest external supplier of PET to the European Union. The government in Ankara initiated a safeguard investigation when its domestic producers experienced margin compression due to cheaper shipments from Vietnam and Egypt. European manufacturers, who faced higher energy and feedstock-related costs, saw their profit margins narrow. This prompted Indorama Ventures to conduct a review of its Rotterdam site operations in 2024.
Other drivers and restraints analyzed in the detailed report include:
- Lightweighting Shift from Glass or Metal to PET in Alcoholic and Dairy Drinks
- Virgin-versus-rPET Price Spread Incentivizes Converter Substitution
- Elevated EU Energy Costs Erode Competitiveness
For complete list of drivers and restraints, kindly check the Table Of Contents.
Segment Analysis
From 2026 to 2031, recycled PET is set to outpace its virgin counterpart, growing at a projected CAGR of 5.73% and steadily expanding its foothold in the European PET market. In 2025, Starlinger's recoSTAR PET art, having secured EFSA approval, adeptly navigated tighter mass-balance regulations. This strategic move not only alleviated compliance hurdles but also drew in fresh investments. While virgin grades, commanding 73.11% of the market (in 2025), remain favored by industries prioritizing consistent melt-flow properties, the ascent of chemical recycling promises to tap into contaminated material streams, diversifying the supply.
Recent mechanical expansions in Portugal, France, and Italy are focusing on clear-bottle loops. In contrast, chemical depolymerization is tackling challenges from opaque and textile waste. To bolster these innovative methods, France has rolled out a cash bonus for biorecycled plastics, effectively mitigating their operational expenses. This initiative highlights a dual recycled-content strategy, customized for different contamination levels. As regulations become more stringent, integrated players proficient in both mechanical and chemical processes gain enhanced sourcing and compliance flexibility, strengthening their competitive edge in the European PET arena.
The Europe Polyethylene Terephthalate (PET) Market Report is Segmented by Source Type (Virgin PET, Recycled PET), End-User Industry (Packaging, Automotive, Building and Construction, Electrical and Electronics, Industrial and Machinery, and Other End-User Industries), and Geography (France, Germany, Italy, Russia, United Kingdom, and Rest of Europe). The Market Forecasts are Provided in Terms of Volume (Tons).
List of Companies Covered in this Report:
- Alpek S.A.B. de C.V.
- ALPLA Group
- Equipolymers
- Indorama Ventures Public Company Limited
- JBF Industries Ltd
- Loop Industries
- NAN YA POLYESTER
- NEO GROUP, UAB
- NOVAPET, S.A.
- Plastipak Holdings, Inc.
- Polyplex
- SIBUR Holding PJSC
- Toray Industries Inc.
Additional Benefits:
- The market estimate (ME) sheet in Excel format
- 3 months of analyst support
TABLE OF CONTENTS
1 Introduction
- 1.1 Study Assumptions and Market Definition
- 1.2 Scope of the Study
2 Research Methodology
3 Executive Summary
4 Market Landscape
- 4.1 Market Overview
- 4.2 Market Drivers
- 4.2.1 EU Single-Use Plastics Directive mandates 25% rPET in beverage bottles
- 4.2.2 Deposit-Return-Scheme (DRS) expansion boosts PET bale quality and volumes
- 4.2.3 Lightweighting shift from glass/metal to PET in alcoholic and dairy drinks
- 4.2.4 Virgin-vs-rPET price spread incentivises converter substitution
- 4.2.5 Chemical-recycling build-out secures food-grade rPET supply
- 4.3 Market Restraints
- 4.3.1 Low-cost PET imports (TR, EG, VN) squeeze EU producer margins
- 4.3.2 Elevated EU energy costs erode competitiveness
- 4.3.3 NGO anti-plastic campaigns drive aluminium substitution in beverages
- 4.4 Value Chain Analysis
- 4.5 Porter's Five Forces
- 4.5.1 Threat of New Entrants
- 4.5.2 Bargaining Power of Suppliers
- 4.5.3 Bargaining Power of Buyers
- 4.5.4 Threat of Substitutes
- 4.5.5 Industry Rivalry
- 4.6 Import and Export Trends
- 4.7 Price Trends
- 4.8 Form Trends
- 4.9 Recycling Overview
- 4.10 Regulatory Framework
- 4.10.1 EU
- 4.10.2 France
- 4.10.3 Germany
- 4.10.4 Italy
- 4.10.5 Russia
- 4.10.6 United Kingdom
- 4.11 End-use Sector Trends
- 4.11.1 Aerospace (Aerospace Component Production Revenue)
- 4.11.2 Automotive (Automobile Production)
- 4.11.3 Building and Construction (New Construction Floor Area)
- 4.11.4 Electrical and Electronics (Electrical and Electronics Production Revenue)
- 4.11.5 Packaging (Plastic Packaging Volume)
5 Market Size and Growth Forecasts (Volume)
- 5.1 By Source Type
- 5.1.1 Virgin PET
- 5.1.2 Recycled PET (rPET)
- 5.2 By End-User Industry
- 5.2.1 Packaging
- 5.2.2 Automotive
- 5.2.3 Building and Construction
- 5.2.4 Electrical and Electronics
- 5.2.5 Industrial and Machinery
- 5.2.6 Other End-user Industries
- 5.3 By Geography
- 5.3.1 France
- 5.3.2 Germany
- 5.3.3 Italy
- 5.3.4 Russia
- 5.3.5 United Kingdom
- 5.3.6 Rest of Europe
6 Competitive Landscape
- 6.1 Market Concentration
- 6.2 Strategic Moves
- 6.3 Market Share(%)/Ranking Analysis
- 6.4 Company Profiles (includes Global Overview, Market Overview, Core Segments, Financials, Strategic Information, Products and Services, Recent Developments)
- 6.4.1 Alpek S.A.B. de C.V.
- 6.4.2 ALPLA Group
- 6.4.3 Equipolymers
- 6.4.4 Indorama Ventures Public Company Limited
- 6.4.5 JBF Industries Ltd
- 6.4.6 Loop Industries
- 6.4.7 NAN YA POLYESTER
- 6.4.8 NEO GROUP, UAB
- 6.4.9 NOVAPET, S.A.
- 6.4.10 Plastipak Holdings, Inc.
- 6.4.11 Polyplex
- 6.4.12 SIBUR Holding PJSC
- 6.4.13 Toray Industries Inc.
7 Market Opportunities and Future Outlook
- 7.1 White-space and Unmet-Need Assessment
8 Key Strategic Questions for CEOs

