
PUBLISHER: Mordor Intelligence | PRODUCT CODE: 2044149

PUBLISHER: Mordor Intelligence | PRODUCT CODE: 2044149
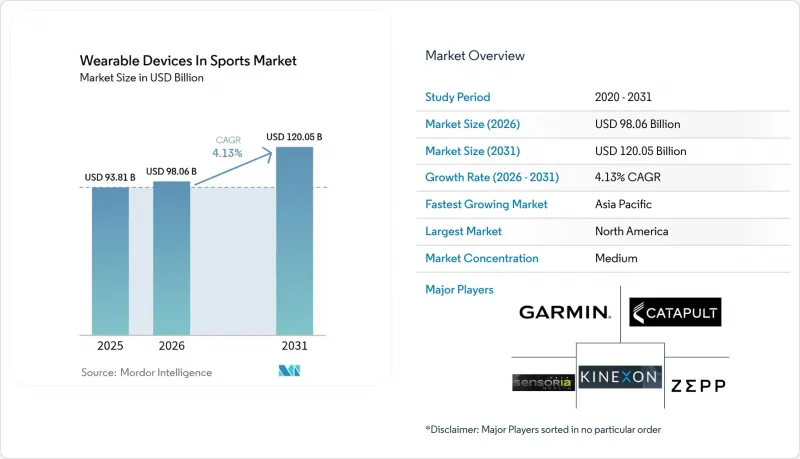
Wearable Devices In Sports - Market Share Analysis, Industry Trends & Statistics, Growth Forecasts (2026 - 2031)
The wearable devices in sports market size is expected to increase from USD 93.81 billion in 2025 to USD 98.06 billion in 2026 and reach USD 120.05 billion by 2031, growing at a CAGR of 4.13% over 2026-2031.
Professional leagues now embed biometric tracking in collective-bargaining agreements, while recreational users adopt AI-driven coaching that assigns real-time injury-risk scores. Sony's 2025 purchase of STATSports exemplifies a shift toward platform consolidation that marries sensor hardware with cloud analytics. Textile-integrated sensors that capture kinetic, thermal, and electrophysiological signals without restricting movement move the category beyond wristbands, supporting demand for garments that feel like ordinary sportswear. North American dominance rests on National Football League and Major League Baseball mandates for head-impact and pitch-biomechanics monitoring, yet Asia-Pacific posts faster growth as Indian cricket and Chinese academy programs institutionalize GPS tracking. Headline risks center on new data-privacy clauses in collective-bargaining agreements that restrict third-party sales of biometric data and slow product rollouts.
Global Wearable Devices In Sports Market Trends and Insights
Growing Demand for Data-Driven Performance Analytics
Teams now treat biometric metrics as contractual deliverables, embedding recovery scores in player-availability clauses. The Association of Tennis Professionals approved in-competition wearables in 2024, allowing real-time coaching adjustments that rely on exertion thresholds and court-coverage heat maps. Collegiate recruiters request multi-year datasets from prospects, creating a secondary market for longitudinal performance archives. The National Football League Players Association opened a centralized repository in 2024 so athletes can license anonymized data to researchers while retaining veto rights over commercial use. Insurers also price injury risk off historical wearable trends, further embedding analytics in contract negotiations. This institutionalization transforms wearables from optional gadgets into required infrastructure.
Rising Integration of AI-Powered Multi-Sensor Wearables
Modern devices fuse inertial measurement units, photoplethysmography, bioimpedance, and multi-band GNSS into single form factors. Samsung's Galaxy Watch7, released in February 2026, houses on-device neural networks that classify workout intensity without cloud latency, mitigating data-leakage fears during live competition. Garmin's HRM-600 chest strap pairs ECG-grade heart monitoring with running-dynamics pods that track ground-contact time for endurance athletes demanding clinical-level precision. Kinexon's EuroLeague deployment uses ultra-wideband anchors to triangulate player positions within 10 cm, feeding fatigue indices directly to bench coaches. Edge processing lowers dependence on post-session analysis, enabling in-game tactical pivots once confined to halftime.
High Initial Device Cost and Tight Athletics Budgets
Enterprise-grade kits from Catapult or STATSports cost more than USD 50,000 per team, with annual software fees of USD 10,000-30,000, squeezing Division II and III college programs. Recreational athletes balk at USD 300-500 devices bundled with ongoing subscriptions when free smartphone apps deliver basic tracking. This bifurcation creates premium professional tiers and commoditized consumer segments, limiting cross-subsidization that could fund feature innovation.
Other drivers and restraints analyzed in the detailed report include:
- Expansion of Global Sports Events and Fan-Engagement Platforms
- Portable and Convenient Form Factors Boosting Daily Adoption
- Escalating Consumer Data-Privacy and Security Concerns
For complete list of drivers and restraints, kindly check the Table Of Contents.
Segment Analysis
In 2025, fitness and heart-rate monitors commanded 38.21% of wearable devices in sports market share, reflecting entrenched adoption among recreational runners and cyclists. Smart clothing and e-textiles are projected to grow at a 6.93% CAGR, outpacing the overall wearable devices in sports market size growth as athletes shift toward garments that eliminate the need to remember separate gadgets. Garmin's Forerunner 970, launched in May 2025, uses multi-band GNSS to retain accuracy in dense urban terrain. FORM's Smart Swim 2 goggles, released in August 2024, overlay live metrics onto transparent displays, removing the cognitive disruption of mid-stroke wrist checks.
Footwear sensors gained traction after PlayerMaker's Bundesliga partnership, measuring ball-contact quality that was once laboratory-bound. Head-mounted augmented-reality displays, such as Garmin's Xero L60i introduced in January 2026, project golf yardage onto eyewear lenses, hinting at wider acceptance of heads-up interfaces. Ingestible sensors like the FDA-cleared e-Celsius capsule track core temperature for NFL teams but face cost and athlete-acceptance barriers. Graphene-infused fabrics promise machine-washable conductivity, potentially rendering rigid sensor housings obsolete during the forecast horizon
Soccer and football held 26.43% of 2025 revenue as European clubs normalized GPS tracking for positional play optimization. Swimming and aquatics, however, will surpass overall wearable devices in sports market size growth, posting a 7.01% CAGR through 2031. Prevent Biometrics' mouthguard logs American-football head impacts to document concussion exposure for liability mitigation. Baseball leverages Motus Global's mThrow 2.0 elbow sleeve to monitor ulnar-collateral-ligament stress in pitchers.
Cricket adoption accelerated after ICC approvals, with India's national team deploying Catapult units for bowler workload management. Cycling and triathlon athletes demand devices that transition through swim, bike, and run modes, a gap Garmin filled with the Forerunner 570. Extreme-sports participants value ruggedness and multi-day battery life, met by Apple's Watch Ultra 3 rated for 36-hour runtime and 40-m depth. The aquatics surge underscores a wider pivot toward discipline-specific solutions over generic trackers.
The Wearable Devices in Sports Market Report is Segmented by Device Type (Fitness and Heart-Rate Monitors, Smart Clothing and E-Textiles, and More), Sport (Soccer / Football, Basketball, and More), End User(Professional Teams and Leagues, and More), Distribution Channel (Online, Specialty Sports Stores, Mass-Retail and Electronics Chains, and More), and Geography. The Market Forecasts are Provided in Terms of Value (USD).
Geography Analysis
North America retained 41.72% revenue in 2025, powered by league mandates for head-impact and pitch-biomechanics monitoring. Division I universities dedicate seven-figure budgets to satisfy NCAA health guidelines, providing a captive enterprise clientele. High consumer purchasing power sustains premium average selling prices and supports a profitable ecosystem for vendors.
Asia-Pacific will grow at 4.98% CAGR as China's government-backed academies use wearable benchmarks for talent identification and India's cricket federation normalizes GPS tracking. Japan's aging population adopts devices to track fall risk, while South Korean carriers subsidize Galaxy Watch models through connectivity bundles. These factors simultaneously expand the addressable base beyond competitive athletes.
Europe balances stringent GDPR requirements with strong sports-science investments by professional football leagues. The British and Irish Lions' 2025 workload-streaming initiative illustrates monetization paths that offset compliance costs. Middle Eastern governments invest in stadiums wired for augmented-reality analytics to diversify economies. South America endures tariff-driven price inflation, though Brazilian clubs adopt GPS to keep pace with European standards. African uptake is nascent, anchored in South African rugby and Kenyan distance-running programs but constrained by device costs and connectivity gaps.
- Kinexon GmbH
- Garmin Ltd.
- Sensoria Inc.
- Zepp Health Corporation
- Catapult Group International Ltd.
- Samsung Electronics Co., Ltd.
- Alphabet Inc. (Google LLC / Fitbit LLC)
- STATSports Group Ltd.
- Whoop, Inc.
- Polar Electro Oy
- Carre Technologies Inc. (Hexoskin)
- Zephyr Technology Corporation
- Firstbeat Technologies Oy
- Apple Inc.
- Playermaker Ltd.
- Motus Global LLC
- X2 Biosystems, Inc.
- Nix, Inc.
- hDrop Technologies, Inc.
- Adidas AG
Additional Benefits:
- The market estimate (ME) sheet in Excel format
- 3 months of analyst support
TABLE OF CONTENTS
1 INTRODUCTION
- 1.1 Study Assumptions and Market Definition
- 1.2 Scope of the Study
2 RESEARCH METHODOLOGY
3 EXECUTIVE SUMMARY
4 MARKET LANDSCAPE
- 4.1 Market Overview
- 4.2 Market Drivers
- 4.2.1 Growing Demand for Data-Driven Performance Analytics
- 4.2.2 Rising Integration of AI-Powered Multi-Sensor Wearables
- 4.2.3 Expansion of Global Sports Events and Fan-Engagement Platforms
- 4.2.4 Portable and Convenient Form-Factors Boosting Daily Adoption
- 4.2.5 League-Sanctioned Biometric-Data Monetization Frameworks
- 4.2.6 Textile-Integrated Multimodal Sensors for Injury Prevention
- 4.3 Market Restraints
- 4.3.1 High Initial Device Cost and Tight Athletics Budgets
- 4.3.2 Escalating Consumer Data-Privacy and Security Concerns
- 4.3.3 Interoperability Gaps Across Vendor Data Ecosystems
- 4.3.4 Collective-Bargaining Limits on Biometric Data Use
- 4.4 Industry Value-Chain Analysis
- 4.5 Regulatory Landscape
- 4.6 Technological Outlook
- 4.7 Porter's Five Forces Analysis
- 4.7.1 Bargaining Power of Buyers
- 4.7.2 Bargaining Power of Suppliers
- 4.7.3 Threat of New Entrants
- 4.7.4 Threat of Substitutes
- 4.7.5 Competitive Rivalry
5 MARKET SIZE AND GROWTH FORECASTS (VALUE)
- 5.1 By Device Type
- 5.1.1 Fitness and Heart-Rate Monitors
- 5.1.2 Smart Clothing and E-Textiles
- 5.1.3 GPS / GNSS Trackers
- 5.1.4 Camera-Based and Vision Wearables
- 5.1.5 Footwear and In-Shoe Sensors
- 5.1.6 Head-Mounted and AR Displays
- 5.1.7 Ingestible and Other Emerging Sensors
- 5.2 By Sport
- 5.2.1 Soccer / Football
- 5.2.2 Basketball
- 5.2.3 American Football and Rugby
- 5.2.4 Baseball / Softball
- 5.2.5 Cricket
- 5.2.6 Golf and Tennis
- 5.2.7 Cycling and Triathlon
- 5.2.8 Swimming and Aquatics
- 5.2.9 Extreme and Adventure Sports
- 5.3 By End User
- 5.3.1 Professional Teams and Leagues
- 5.3.2 Collegiate / University Programs
- 5.3.3 Amateur and Club Athletes
- 5.3.4 Recreational Fitness Enthusiasts
- 5.3.5 Sports Academies and Training Centers
- 5.3.6 Medical and Rehab Facilities
- 5.4 By Distribution Channel
- 5.4.1 Online (Direct and Marketplaces)
- 5.4.2 Specialty Sports Stores
- 5.4.3 Mass-Retail and Electronics Chains
- 5.4.4 Team / Enterprise Contracts
- 5.5 By Geography
- 5.5.1 North America
- 5.5.1.1 United States
- 5.5.1.2 Canada
- 5.5.1.3 Mexico
- 5.5.2 South America
- 5.5.2.1 Brazil
- 5.5.2.2 Argentina
- 5.5.2.3 Rest of South America
- 5.5.3 Europe
- 5.5.3.1 Germany
- 5.5.3.2 United Kingdom
- 5.5.3.3 France
- 5.5.3.4 Italy
- 5.5.3.5 Spain
- 5.5.3.6 Rest of Europe
- 5.5.4 Asia-Pacific
- 5.5.4.1 China
- 5.5.4.2 India
- 5.5.4.3 Japan
- 5.5.4.4 South Korea
- 5.5.4.5 Australia and New Zealand
- 5.5.4.6 Rest of Asia-Pacific
- 5.5.5 Middle East
- 5.5.5.1 Saudi Arabia
- 5.5.5.2 United Arab Emirates
- 5.5.5.3 Turkey
- 5.5.5.4 Rest of Middle East
- 5.5.6 Africa
- 5.5.6.1 South Africa
- 5.5.6.2 Nigeria
- 5.5.6.3 Egypt
- 5.5.6.4 Rest of Africa
- 5.5.1 North America
6 COMPETITIVE LANDSCAPE
- 6.1 Market Concentration
- 6.2 Strategic Moves
- 6.3 Market Share Analysis
- 6.4 Company Profiles (includes Global Level Overview, Market Level Overview, Core Segments, Financials as available, Strategic Information, Market Rank/Share, Products and Services, Recent Developments)
- 6.4.1 Kinexon GmbH
- 6.4.2 Garmin Ltd.
- 6.4.3 Sensoria Inc.
- 6.4.4 Zepp Health Corporation
- 6.4.5 Catapult Group International Ltd.
- 6.4.6 Samsung Electronics Co., Ltd.
- 6.4.7 Alphabet Inc. (Google LLC / Fitbit LLC)
- 6.4.8 STATSports Group Ltd.
- 6.4.9 Whoop, Inc.
- 6.4.10 Polar Electro Oy
- 6.4.11 Carre Technologies Inc. (Hexoskin)
- 6.4.12 Zephyr Technology Corporation
- 6.4.13 Firstbeat Technologies Oy
- 6.4.14 Apple Inc.
- 6.4.15 Playermaker Ltd.
- 6.4.16 Motus Global LLC
- 6.4.17 X2 Biosystems, Inc.
- 6.4.18 Nix, Inc.
- 6.4.19 hDrop Technologies, Inc.
- 6.4.20 Adidas AG
7 MARKET OPPORTUNITIES AND FUTURE OUTLOOK
- 7.1 White-Space and Unmet-Need Assessment

