
PUBLISHER: Mordor Intelligence | PRODUCT CODE: 2044153

PUBLISHER: Mordor Intelligence | PRODUCT CODE: 2044153
Transparent Display - Market Share Analysis, Industry Trends & Statistics, Growth Forecasts (2026 - 2031)
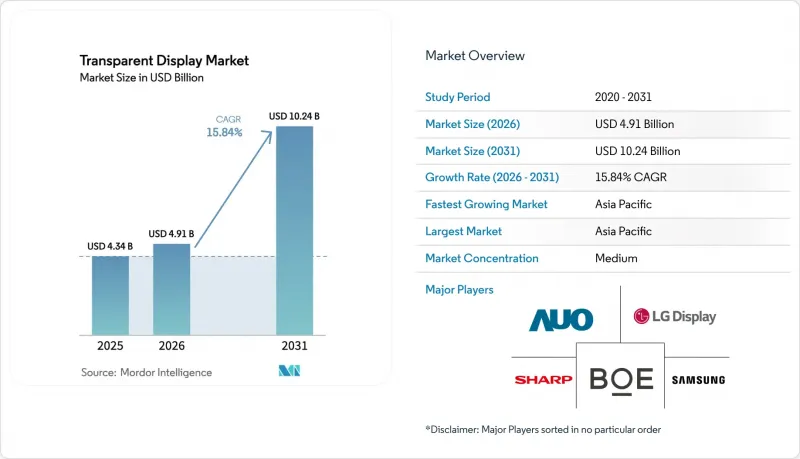
The Transparent display market size was valued at USD 4.34 billion in 2025 and is estimated to grow from USD 4.91 billion in 2026 to reach USD 10.24 billion by 2031, at a CAGR of 15.84% during the forecast period (2026-2031). Automotive original equipment manufacturers are embedding augmented-reality head-up displays, luxury retailers are adopting interactive storefronts to draw consumers back into physical stores, and defense contractors are testing transparent-armor cockpits that keep pilots aware of their surroundings. The formation of the QuadAlliance in February 2026 signals that Tier-1 suppliers now view transparent panels as a scalable platform rather than a niche add-on. Vertically integrated manufacturers continue to absorb the capital burden of Gen 8.6 organic light-emitting diode fabs where initial yields can be as low as 50%. Indium-tin-oxide prices above USD 400 per kilogram outside China are squeezing integrators that lack long-term supply contracts. These converging forces are shaping a market in which scale, secure sourcing, and advanced optics define competitive advantage.
Global Transparent Display Market Trends and Insights
Rising Adoption in Automotive HUD and Cluster Displays
Original equipment manufacturers are embedding transparent displays in windshields and instrument panels so drivers can receive navigation cues and collision alerts without shifting their gaze. The QuadAlliance formed in February 2026 by ZEISS, tesa, Saint-Gobain Sekurit, and Hyundai Mobis is targeting 2029 mass production of holographic head-up displays, tripling vertical field of view compared with today's systems. Visteon partnered with FUTURUS in September 2025 to migrate augmented-reality HUDs into mid-tier sedans, a move that will lower unit costs through higher volumes. Regulatory momentum is visible as UNECE Regulation 125 requires at least 70% transparency for forward-vision devices, while ISO/TS 21957:2023 harmonizes test procedures, cutting approval time by months. Covestro introduced polycarbonate interlayers in March 2025 that pass ISO 16750-3 mechanical-shock tests, giving suppliers confidence to offer multi-year warranties. Collectively, standards clarity, supplier alliances, and ruggedized materials point to transparent HUDs becoming standard on many mainstream vehicles by 2028.
Retail and Digital-signage Demand for Immersive Storefronts
Luxury labels and mall operators are installing transparent displays that overlay rich media onto physical products, turning windows into dynamic advertising canvases. LG Display deployed 55-inch transparent organic light-emitting diode panels across Tokyo boutiques in September 2025 and reported a 30% to 40% lift in dwell time during pilots. Glass-Media introduced ultra-thin transparent LED posters in November 2025 with 85% transparency, enabling retailers to rotate campaigns every few seconds while maintaining unobstructed views. Quick-service restaurants and transit hubs are following suit because transparent panels attach directly to glass doors or partition walls where conventional screens cannot fit. Low-power organic light-emitting diode variants consuming under 50 watts per square meter help chains meet LEED energy prerequisites. As content-management platforms move to the cloud, regional franchises can update hundreds of storefronts remotely, accelerating roll-outs beyond flagship locations.
Low Yield and High CAPEX of Transparent Panel Fabs
Gen 8.6 organic light-emitting diode and micro-LED fabs demand cleanrooms, inkjet printing heads, and multilayer encapsulation tools that push capital expenditure above USD 4 billion, limiting new entrants. TCL CSOT broke ground on such a facility in October 2025 with a USD 4.15 billion budget yet acknowledged yields will hover near 50% during the first production year. Universal Display's third-quarter 2025 results underscored the risk when lower utilization drags on margins across the supply chain. Yield losses originate from particulate contamination in transparent cathodes and water-vapor ingress that degrades organics. Only conglomerates with diversified earnings can endure multi-year payback periods, which curbs global capacity expansion and keeps panel prices elevated until yields climb above 80% post-2028.
Other drivers and restraints analyzed in the detailed report include:
- Rapid AR and VR Headset Proliferation
- Cost-down Roadmap for Micro-LED Transparent Panels
- Indium-tin-oxide Supply Risk and Price Volatility
For complete list of drivers and restraints, kindly check the Table Of Contents.
Segment Analysis
Liquid-crystal display retained the largest 45.13% revenue share in 2025 due to mature tooling and panel prices under USD 100 per square meter. Transparency, however, tops out near 70% and brightness rarely exceeds 500 nits, which restricts outdoor use. Organic light-emitting diode is advancing at a 15.84% CAGR and already meets UNECE photometric criteria for automotive HUDs because self-emissive pixels hit 1,000 nits without a backlight. The transparent display market size for organic light-emitting diode panels is projected to overtake liquid-crystal display revenue by 2029 as retailers and automakers pay premiums for higher contrast. Micro-LED promises even longer lifetimes and is forecast to post the fastest 15.93% CAGR through 2031, supported by fluidic self-assembly and laser mass-transfer techniques that drive defect rates below 10 ppm. Transparent projection and electrochromic films serve specialty installations and smart windows, where imagery resolution is less critical than dynamic opacity or low cost.
Manufacturers segment their portfolios accordingly. Korean firms leverage proprietary organic light-emitting diode stacks to defend high-margin niches, while Chinese producers ship low-cost liquid-crystal display units for indoor signage. Over time, rising yields from Gen 8.6 organic light-emitting diode lines narrow the cost gap with liquid-crystal display, encouraging mid-tier retailers to upgrade. Conversely, aerospace customers favor micro-LED for cockpit transparency near 90% and brightness well above 5,000 nits, performance unattainable with organic light-emitting diode. This bifurcation lets suppliers target discrete use cases rather than pursuing a one-size-fits-all strategy.
Retail and digital signage generated the largest slice of 2025 revenue at 30.47%, driven by immersive storefronts that merge physical goods with digital storytelling. Automotive is on course for the sharpest 16.29% CAGR because head-up and cluster displays are transitioning from luxury options to standard features across volume models. The transparent display market share for automotive applications is expected to rise steadily after 2027 as ISO and UNECE standards reduce homologation risk. Consumer electronics and smart appliances remain a smaller but vibrant niche where micro-organic light-emitting diode advances slash optical crosstalk, improving readability in bright rooms.
Aerospace and defense projects progress slowly under extended procurement cycles, yet high margins compensate for low volumes. Industrial and enterprise deployments such as warehouse pick-to-light systems and medical imaging overlays grow steadily where situational awareness pays productivity dividends. Healthcare and education adopt transparent screens for surgical planning and museum exhibits, though budgets limit unit sales. Overall, OEMs design transparent displays to meet sector-specific standards like SAE J1757/1 and IEC 62471, which elevates certification cost but reinforces vendor lock-in once approvals are secured.
The Transparent Display Market Report is Segmented by Technology (LCD, OLED, Micro-LED, and More), End-User Industry (Retail and Digital Signage, Consumer Electronics and Smart Appliances, and More), Application (Interactive Storefronts, HUD and More), Display Size (Less Than 10", 10"-39", and More), and Geography. The Market Forecasts are Provided in Terms of Value (USD).
Geography Analysis
Asia Pacific generated 40.38% of 2025 sales and will log the highest 16.56% CAGR thanks to China's liquid-crystal display and organic light-emitting diode base and South Korea's premium organic light-emitting diode prowess. BOE demonstrated a 55-inch 4K transparent organic light-emitting diode at CES 2024 and aims to ship in volume, challenging Korean incumbents. LG Display and Samsung unveiled transparent organic light-emitting diode and MicroLED prototypes that cost five-figure sums yet address premium retail and automotive clients. Japan contributes industrial solutions through Sharp and Japan Display, whereas India's adoption is still nascent given limited panel-making capacity.
North America and Europe are mature but regulation driven. The United States imposed a 25% tariff on Chinese indium in September 2024, pushing integrators to lock long-term supply or absorb margin erosion. UNECE Regulation 125 provides clarity on 70% transparency thresholds, accelerating European automaker adoption. Smart-window providers such as Saint-Gobain SageGlass secure Leadership in Energy and Environmental Design points for building owners upgrading their envelopes. The Middle East pursues dual-use facade glass that generates power while streaming media, aligning with net-zero mandates.
South America and Africa remain early-stage markets. Pilot deployments in Brazil's retail sector and South Africa's smart-city corridors demonstrate feasibility but are constrained by import duties and limited capital budgets. Overall, Asia Pacific remains the production powerhouse, while North America and Europe set performance and sustainability benchmarks that reverberate through the supply chain.
List of Companies Covered in this Report:
- LG Display Co., Ltd.
- Samsung Electronics Co., Ltd.
- BOE Technology Group Co., Ltd.
- Leyard Optoelectronic Co., Ltd. (Planar Systems Inc.)
- Panasonic Holdings Corporation
- Sharp Corporation
- AU Optronics Corporation
- Sony Group Corporation
- Crystal Display Systems Ltd.
- Pro Display UK Ltd.
- Hangzhou Hikvision Digital Technology Co., Ltd.
- Nexnovo Technology Co., Ltd.
- Shenzhen AuroLED Technology Co., Ltd.
- Tianma Micro-electronics Co., Ltd.
- Visionox Technology Inc.
- Japan Display Inc.
- 2Point0 Concepts LLC
- Xiaomi Inc.
- Visteon Corporation
- Continental AG
Additional Benefits:
- The market estimate (ME) sheet in Excel format
- 3 months of analyst support
TABLE OF CONTENTS
1 INTRODUCTION
- 1.1 Study Assumptions and Market Definition
- 1.2 Scope of the Study
2 RESEARCH METHODOLOGY
3 EXECUTIVE SUMMARY
4 MARKET LANDSCAPE
- 4.1 Market Overview
- 4.2 Market Drivers
- 4.2.1 Rising Adoption in Automotive HUD and Cluster Displays
- 4.2.2 Retail and Digital-signage Demand for Immersive Storefronts
- 4.2.3 Rapid AR/VR Headset Proliferation
- 4.2.4 Cost-down Roadmap for Micro-LED Transparent Panels
- 4.2.5 Dual-use Facade Glass Integrating Transparent PV-displays
- 4.2.6 Defense Investment in Transparent Armoured Cockpits
- 4.3 Market Restraints
- 4.3.1 Low Yield and High CAPEX of Transparent Panel Fabs
- 4.3.2 Sub-optimal Brightness / contrast Versus Conventional Displays
- 4.3.3 Indium-tin-oxide (ITO) Supply Risk and Price Volatility
- 4.3.4 Automotive Glare-safety Regulations Delaying Roll-outs
- 4.4 Value / Supply-Chain Analysis
- 4.5 Regulatory Landscape
- 4.6 Porter's Five Forces Analysis
- 4.6.1 Threat of New Entrants
- 4.6.2 Bargaining Power of Suppliers
- 4.6.3 Bargaining Power of Buyers
- 4.6.4 Threat of Substitutes
- 4.6.5 Degree of Competition
- 4.7 Impact of Macroeconomic Factors on the Market
5 MARKET SIZE AND GROWTH FORECASTS (VALUE)
- 5.1 By Technology
- 5.1.1 LCD
- 5.1.2 OLED
- 5.1.3 Micro-LED
- 5.1.4 Transparent Projection (LCoS / DLP)
- 5.1.5 Other Technologies
- 5.2 By End-user Industry
- 5.2.1 Retail and Digital Signage
- 5.2.2 Consumer Electronics and Smart Appliances
- 5.2.3 Automotive
- 5.2.4 Aerospace and Defense
- 5.2.5 Industrial and Enterprise
- 5.2.6 Others (Healthcare, Education)
- 5.3 By Application
- 5.3.1 Interactive Storefronts and Showcases
- 5.3.2 Head-Up Displays (HUD)
- 5.3.3 Augmented-Reality Wearables
- 5.3.4 Smart Windows and Architectural Glass
- 5.3.5 Exhibition and Museum Installations
- 5.4 By Display Size
- 5.4.1 Less than 10" (Micro)
- 5.4.2 10" - 39" (Medium)
- 5.4.3 Greater than or equal to 40" (Large)
- 5.5 By Geography
- 5.5.1 North America
- 5.5.1.1 United States
- 5.5.1.2 Canada
- 5.5.1.3 Mexico
- 5.5.2 South America
- 5.5.2.1 Brazil
- 5.5.2.2 Argentina
- 5.5.2.3 Rest of South America
- 5.5.3 Europe
- 5.5.3.1 Germany
- 5.5.3.2 United Kingdom
- 5.5.3.3 France
- 5.5.3.4 Italy
- 5.5.3.5 Rest of Europe
- 5.5.4 Asia-Pacific
- 5.5.4.1 China
- 5.5.4.2 Japan
- 5.5.4.3 South Korea
- 5.5.4.4 India
- 5.5.4.5 Rest of Asia-Pacific
- 5.5.5 Middle East
- 5.5.5.1 Saudi Arabia
- 5.5.5.2 United Arab Emirates
- 5.5.5.3 Rest of Middle East
- 5.5.6 Africa
- 5.5.6.1 South Africa
- 5.5.6.2 Rest of Africa
- 5.5.1 North America
6 COMPETITIVE LANDSCAPE
- 6.1 Market Concentration
- 6.2 Strategic Moves
- 6.3 Market Share Analysis
- 6.4 Company Profiles (includes Global-level Overview, Market-level Overview, Core Segments, Financials as available, Strategic Information, Market Rank/Share for key companies, Products and Services, and Recent Developments)
- 6.4.1 LG Display Co., Ltd.
- 6.4.2 Samsung Electronics Co., Ltd.
- 6.4.3 BOE Technology Group Co., Ltd.
- 6.4.4 Leyard Optoelectronic Co., Ltd. (Planar Systems Inc.)
- 6.4.5 Panasonic Holdings Corporation
- 6.4.6 Sharp Corporation
- 6.4.7 AU Optronics Corporation
- 6.4.8 Sony Group Corporation
- 6.4.9 Crystal Display Systems Ltd.
- 6.4.10 Pro Display UK Ltd.
- 6.4.11 Hangzhou Hikvision Digital Technology Co., Ltd.
- 6.4.12 Nexnovo Technology Co., Ltd.
- 6.4.13 Shenzhen AuroLED Technology Co., Ltd.
- 6.4.14 Tianma Micro-electronics Co., Ltd.
- 6.4.15 Visionox Technology Inc.
- 6.4.16 Japan Display Inc.
- 6.4.17 2Point0 Concepts LLC
- 6.4.18 Xiaomi Inc.
- 6.4.19 Visteon Corporation
- 6.4.20 Continental AG
7 MARKET OPPORTUNITIES AND FUTURE OUTLOOK
- 7.1 White-space and Unmet-need Assessment

