
PUBLISHER: Mordor Intelligence | PRODUCT CODE: 2044161

PUBLISHER: Mordor Intelligence | PRODUCT CODE: 2044161
Electric Vehicle Power Inverter - Market Share Analysis, Industry Trends & Statistics, Growth Forecasts (2026 - 2031)
The Electric Vehicle Power Inverter market size is projected to expand from USD 8.97 billion in 2025 and USD 10.67 billion in 2026 to USD 25.41 billion by 2031, registering an 18.95% CAGR between 2026 and 2031.
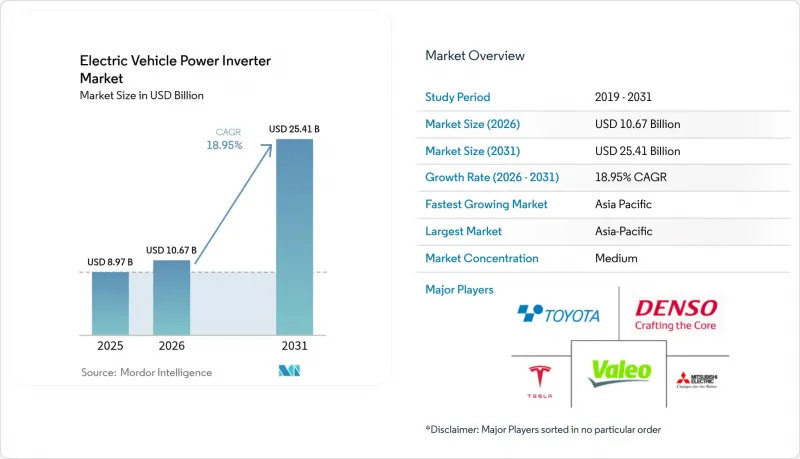
Momentum in the Electric Vehicle Power Inverter market is driven by three forces: the wider adoption of 800-volt electrical architectures, the commercialization of silicon-carbide power semiconductors, and zero-emission regulations that phase out internal-combustion drivetrains in the largest auto-producing economies. Battery-electric models continue to anchor demand, but hydrogen fuel-cell programs aimed at heavy trucks and buses signal a diversified propulsion landscape that will keep design requirements fluid. Tier-1 suppliers are sharpening their focus on integrated e-Axles, betting that consolidating the motor, inverter, and gearbox into a single housing will give automakers a cost-and-weight advantage when high-volume platforms launch after 2026. At the same time, silicon-carbide capacity expansions, from Wolfspeed in North Carolina to Infineon in Dresden, underscore industry consensus that wide-bandgap devices, not legacy silicon IGBTs, will unlock the next step-change in inverter efficiency.
Global Electric Vehicle Power Inverter Market Trends and Insights
Rapid Advances in SiC & GaN Power Semiconductors
Silicon-carbide MOSFETs and gallium-nitride HEMTs allow junction temperatures up to 175 °C, compared with 150 °C for silicon IGBTs, which reduces heat-sink mass and increases power density . Wolfspeed's USD 6.5 billion Mohawk Valley capacity build, and Infineon's EUR 5 billion (~USD 6.5 billion) Dresden expansion illustrate how wafer supply is scaling to automotive volumes. Gallium-nitride still skews toward onboard chargers, yet the mainstream inverter roadmap is firmly SiC, especially for >=800-V platforms where switching-loss savings are multiplied. Legacy IGBTs hold share because their cost profile suits price-sensitive 400-V cars, but the efficiency delta widens each model year, accelerating the migration to wide-bandgap. Functional-safety validation under ISO 26262 adds up-front testing, but the long-term reliability data collected by early movers lowers the barrier for fast followers.
OEM Transition to 800-V Vehicle Platforms
Automakers adopt >=800-V systems to halve DC-fast-charge times and trim copper harness mass by nearly one-third. Early showcases such as the Porsche Taycan and Hyundai Ioniq 5 proved the concept, and BMW's Neue Klasse platform will bring high-voltage stacks into the premium-volume segment in 2027. Inverter designs must now withstand higher blocking voltages and faster dv/dt, a specification window that plays to suppliers with advanced package insulation and low-inductance layouts. Public chargers lag because most existing sites are 400 V, forcing dual-voltage compatibility that complicates inverter control loops. Even so, the performance narrative resonates with buyers, prompting OEMs to lock in 800-V supply contracts well before mass production kicks off.
High SiC Device Cost & Supply Volatility
Silicon-carbide wafers cost multiples of silicon, and capacity is concentrated among five foundries, leaving OEMs exposed to spot-price swings when demand spikes. Automotive qualification runs 18-24 months, so new fabs only ease shortages with a significant lag. Some automakers hedge by dual-sourcing SiC and legacy IGBT parts, trading efficiency for supply security. Export-control uncertainty adds further risk because crucible and crystal-growth tools come from a narrow supplier base. As a stopgap, several tier-1s hold strategic inventory, but carrying costs erode margin.
Other drivers and restraints analyzed in the detailed report include:
- Rising Demand for Electric Vehicles
- Government Incentives & Emission Mandates
- Thermal-Management Complexity >=300 kW
For complete list of drivers and restraints, kindly check the Table Of Contents.
Segment Analysis
Battery-electric cars retain 54.12% of the electric-vehicle power inverter market share in 2025, driven by dense charging networks in China and Europe. In contrast, plug-in hybrids serve as transitional solutions in regions where grid upgrades lag. Fuel-cell electric vehicles are projected to post the fastest 19.35% CAGR through 2031, as hydrogen corridors in Japan, South Korea, and parts of Europe reduce the risk of refueling infrastructure. Hybrid electrics without external charging contracts steadily because regulatory rules now credit zero tailpipe emissions rather than partial electrification.
Fuel-cell stacks output lower DC voltages than lithium-ion packs, so their inverters pair with step-down DC-DC converters and low-inductance busbars that manage rapid current rise when drivers demand torque. Continuous power delivery without battery-temperature limits favors long-haul buses and trucks where battery mass would otherwise exceed freight payload. Growth hinges on green-hydrogen cost trajectories and station density, both of which are trending positively as electrolyzer deployments piggyback on renewable overcapacity.
Passenger cars commanded 63.91% of the electric vehicle power inverter market size in 2025, reflecting consumer uptake in the core auto markets, while heavy commercial vehicles and buses posted the strongest 19.42% CAGR as zero-emission zones lock diesel fleets out of cities. Light commercial vans also benefit from depot charging but are more price-sensitive, so adoption lags passenger cars until battery cost curves flatten.
Inverters for 40-ton trucks must handle continuous ratings above 300 kW and withstand vibration cycles far beyond those of passenger cars. Designs therefore emphasize reinforced busbars, redundant current sensors, and megawatt charging compatibility per CharIN's specification. Passenger-car units focus on acoustic comfort and compact housings, while city-bus variants allow more envelope space in exchange for serviceability and thermal headroom.
The Electric Vehicle Power Inverter Market Report is Segmented by Propulsion Type (HEV, PHEV, BEV, and FCEV), Vehicle Type (Passenger Cars, Light Commercial Vehicles, and More), Voltage Architecture (Less Than or Equal To 400V and More), Semiconductor Material (Silicon IGBT and More), Integration Level (Stand-Alone, E-Axle, and CIDD), and Geography. Market Forecasts are Provided in Terms of Value (USD).
Geography Analysis
Asia Pacific held a 39.19% of the electric-vehicle power inverter market share in 2025 and is forecasted to expand at a 19.36% CAGR through 2031. China dominates the regional electric-vehicle power-inverter market owing to vertically integrated supply chains that span from SiC wafer growth to final vehicle assembly under one corporate umbrella. Japan leverages decades of power-electronics know-how, with Denso and Mitsubishi Electric holding preferred-supplier status within local OEM ecosystems. South Korea's Hyundai Mobis partners with LG Energy Solution to roll out 800-V systems that rank among the highest-charging-speed models on sale.
Europe trails in absolute volume but benefits from tight carbon legislation that provides visibility into demand. German, French, and Scandinavian automakers localize inverter sourcing to meet domestic-content thresholds and de-risk long supply lines. Semiconductor fabs in Dresden and Catania receive public funding packages to ensure that SiC volumes remain within the single market once combustion bans take effect after 2035.
North America's growth rests on the Inflation Reduction Act, which ties a USD 7,500 consumer credit to final-assembly and mineral-origin rules that ripple through inverter sourcing. Wolfspeed's North Carolina mega-fab and emerging tier-1 e-Axle plants in the Midwest bring critical stages stateside, but the rollout of charging infrastructure lags coastal adoption. The region's suppliers, therefore, prioritize modular designs that support both 400-V legacy and 800-V next-gen vehicles to address a bifurcated market landscape.
- Robert Bosch GmbH
- DENSO Corporation
- Toyota Industries Corporation
- Hitachi Astemo Ltd
- Meidensha Corporation
- BorgWarner Inc.
- Mitsubishi Electric Corp.
- Tesla Inc.
- Marelli Holdings
- Valeo SA
- Lear Corporation
- Infineon Technologies AG
- Eaton Corporation
- STMicroelectronics N.V.
- ON Semiconductor Corp.
- Wolfspeed Inc.
- ROHM Semiconductor
- Continental AG
- ZF Friedrichshafen AG
- Dana Incorporated
Additional Benefits:
- The market estimate (ME) sheet in Excel format
- 3 months of analyst support
TABLE OF CONTENTS
1 Introduction
- 1.1 Study Assumptions & Market Definition
- 1.2 Scope of the Study
2 Research Methodology
3 Executive Summary
4 Market Landscape
- 4.1 Market Overview
- 4.2 Market Drivers
- 4.2.1 Rapid Advances in SiC & GaN Power Semiconductors
- 4.2.2 OEM Transition to 800V Vehicle Platforms
- 4.2.3 Rising Demand for Electric Vehicles
- 4.2.4 Government Incentives & Emission Mandates
- 4.2.5 Bidirectional V2G-Ready Inverter Architectures
- 4.2.6 Tier-1 Scale-Driven Cost Reductions
- 4.3 Market Restraints
- 4.3.1 High SiC Device Cost & Supply Volatility
- 4.3.2 Thermal-Management Complexity at More than 300 kW
- 4.3.3 Charging-Infrastructure Bottlenecks
- 4.3.4 Cyber-Security Risk in V2G-Enabled Inverters
- 4.4 Value / Supply-Chain Analysis
- 4.5 Regulatory Landscape
- 4.6 Technological Outlook
- 4.7 Porter's Five Forces
- 4.7.1 Bargaining Power of Suppliers
- 4.7.2 Bargaining Power of Buyers
- 4.7.3 Threat of New Entrants
- 4.7.4 Threat of Substitutes
- 4.7.5 Intensity of Rivalry
5 Market Size & Growth Forecasts (Value (USD))
- 5.1 By Propulsion Type
- 5.1.1 Hybrid Electric Vehicle (HEV)
- 5.1.2 Plug-in Hybrid Electric Vehicle (PHEV)
- 5.1.3 Battery Electric Vehicle (BEV)
- 5.1.4 Fuel Cell Electric Vehicle (FCEV)
- 5.2 By Vehicle Type
- 5.2.1 Passenger Cars
- 5.2.2 Light Commercial Vehicles
- 5.2.3 Heavy Commercial Vehicles & Buses
- 5.3 By Voltage Architecture
- 5.3.1 Less than or equal to 400 V Systems
- 5.3.2 401-799 V Systems
- 5.3.3 More than or equal to 800 V Systems
- 5.4 By Semiconductor Material
- 5.4.1 Silicon IGBT
- 5.4.2 Silicon-Carbide MOSFET
- 5.4.3 Gallium-Nitride HEMT
- 5.5 By Integration Level
- 5.5.1 Stand-alone Inverter
- 5.5.2 Integrated e-Axle (Motor + Inverter + Gearbox)
- 5.5.3 Combined Inverter + DC/DC (CIDD)
- 5.6 By Geography
- 5.6.1 North America
- 5.6.1.1 United States
- 5.6.1.2 Canada
- 5.6.1.3 Rest of North America
- 5.6.2 South America
- 5.6.2.1 Brazil
- 5.6.2.2 Argentina
- 5.6.2.3 Rest of South America
- 5.6.3 Europe
- 5.6.3.1 Germany
- 5.6.3.2 United Kingdom
- 5.6.3.3 France
- 5.6.3.4 Italy
- 5.6.3.5 Spain
- 5.6.3.6 Russia
- 5.6.3.7 Rest of Europe
- 5.6.4 Asia Pacific
- 5.6.4.1 China
- 5.6.4.2 Japan
- 5.6.4.3 India
- 5.6.4.4 South Korea
- 5.6.4.5 Rest of Asia Pacific
- 5.6.5 Middle East and Africa
- 5.6.5.1 Saudi Arabia
- 5.6.5.2 United Arab Emirates
- 5.6.5.3 Turkey
- 5.6.5.4 South Africa
- 5.6.5.5 Egypt
- 5.6.5.6 Nigeria
- 5.6.5.7 Rest of Middle East and Africa
- 5.6.1 North America
6 Competitive Landscape
- 6.1 Market Concentration
- 6.2 Strategic Moves
- 6.3 Market Share Analysis
- 6.4 Company Profiles (Includes Global Level Overview, Market Level Overview, Core Segments, Financials as Available, Strategic Information, Market Rank/Share for Key Companies, Products and Services, SWOT Analysis, and Recent Developments)
- 6.4.1 Robert Bosch GmbH
- 6.4.2 DENSO Corporation
- 6.4.3 Toyota Industries Corporation
- 6.4.4 Hitachi Astemo Ltd
- 6.4.5 Meidensha Corporation
- 6.4.6 BorgWarner Inc.
- 6.4.7 Mitsubishi Electric Corp.
- 6.4.8 Tesla Inc.
- 6.4.9 Marelli Holdings
- 6.4.10 Valeo SA
- 6.4.11 Lear Corporation
- 6.4.12 Infineon Technologies AG
- 6.4.13 Eaton Corporation
- 6.4.14 STMicroelectronics N.V.
- 6.4.15 ON Semiconductor Corp.
- 6.4.16 Wolfspeed Inc.
- 6.4.17 ROHM Semiconductor
- 6.4.18 Continental AG
- 6.4.19 ZF Friedrichshafen AG
- 6.4.20 Dana Incorporated
7 Market Opportunities & Future Outlook
- 7.1 White-space & Unmet-need Assessment

