PUBLISHER: Mordor Intelligence | PRODUCT CODE: 2044175

PUBLISHER: Mordor Intelligence | PRODUCT CODE: 2044175
Hyper-Converged Infrastructure - Market Share Analysis, Industry Trends & Statistics, Growth Forecasts (2026 - 2031)
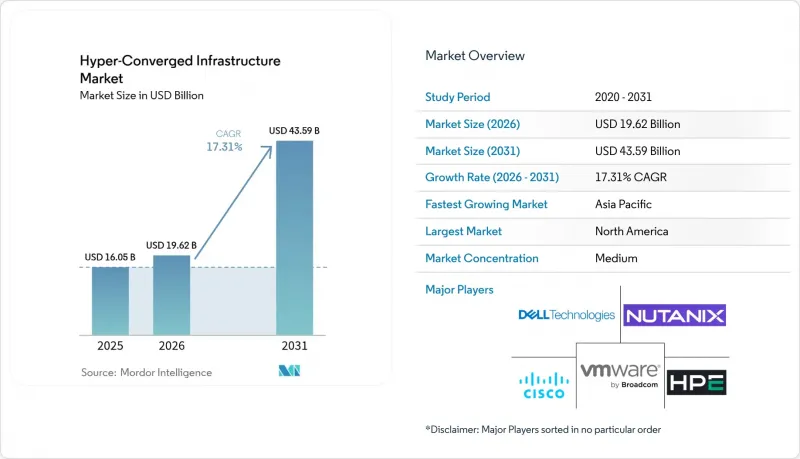
The hyper-converged infrastructure market size is expected to increase from USD 16.05 billion in 2025 to USD 19.62 billion in 2026 and reach USD 43.59 billion by 2031, growing at a CAGR of 17.31% over 2026-2031.
Enterprise buyers are accelerating refresh cycles because Broadcom's 2024 decision to retire VMware perpetual licenses upended twenty years of virtualization economics and triggered the largest platform-migration wave since x86 server consolidation began. Sovereign-AI mandates, retail edge roll-outs, and the arrival of RISC-V appliances have drawn new entrants that compete on open-source flexibility rather than raw hardware scale, tilting advantage toward Nutanix, Microsoft Azure Stack HCI, and Scale Computing. Buyers view software-defined storage, Kubernetes-native orchestration, and NVMe performance density as decisive differentiators, especially where electricity prices or grid queues cap power budgets. Taken together, these conditions position agile vendors to enlarge share while incumbent three-tier suppliers defend shrinking, price-sensitive niches.
Global Hyper-Converged Infrastructure Market Trends and Insights
Data-center Consolidation Wave
Financial-services, healthcare, and government agencies are collapsing scattered three-tier stacks into converged nodes to reclaim floor space and slash cooling overhead. Nutanix disclosed that 85% of VMware customers assessing alternatives cited lock-in risk and unpredictable pricing, prompting 48% to launch proofs of concept during 2024. JPMorgan Chase migrated 1,200 branches to Azure Stack HCI in 2025, cutting annual maintenance by USD 18 million. Mayo Clinic achieved 99.99% uptime across 15 campuses after shifting electronic health records to Nutanix, reducing disaster-recovery hardware 60%. Because refresh windows in regulated industries run three to five years, the hyper-converged infrastructure market enjoys durable visibility once conversions begin.
Surging Cloud-native Workload Adoption
Containerised applications already represent 90% of new enterprise workloads, with 98% of organizations running Kubernetes in hybrid mode. Dell's VxRail 8.0 embeds Red Hat OpenShift, enabling persistent storage for stateful containers without external arrays. Microsoft extended Azure Arc governance to Azure Stack HCI, letting administrators impose uniform policy across thousands of edge clusters. The operational burden of multicluster lifecycle management makes turnkey nodes attractive, especially where 85% of enterprises piloting GenAI demand on-prem LLM inference with near-zero latency to vector databases. Consequently, the hyper-converged infrastructure market is becoming the default substrate for cloud-native workloads that cannot reside in public regions because of data-sovereignty or performance constraints.
Per-node Scalability Ceiling for High-end Workloads
Most hyper-converged platforms cap clusters at 64 hosts and 200 VMs per host, limiting suitability for AI training, HPC, or multi-petabyte databases. VMware vSAN, Dell VxRail, and Nutanix enforce similar boundaries to maintain metadata consistency. Cleveland Clinic therefore selected composable infrastructure for its 8-petabyte EHR footprint. All-reduce operations across hundreds of GPUs still favour NVIDIA DGX-class clusters, curbing high-end share for the hyper-converged infrastructure market until CXL-enabled memory fabrics mature.
Other drivers and restraints analyzed in the detailed report include:
- Lower TCO Versus Legacy Three-tier Architecture
- Edge Computing Roll-outs in Telco and Retail
- Vendor Lock-in Concerns for Enterprise Buyers
For complete list of drivers and restraints, kindly check the Table Of Contents.
Segment Analysis
The software category is expanding at an 18.21% CAGR through 2031, even though hardware still held 58.84% of the hyper-converged infrastructure market share in 2025. Nutanix's GPT-in-a-Box II and Microsoft's Azure Arc integration exemplify demand for turnkey orchestration stacks that decouple workloads from proprietary hypervisors. Container Storage Interface adoption lets developers treat storage as code, accelerating software substitution for array-centric designs.
Hardware remains essential for latent installed bases executing multi-year depreciation schedules, yet appliance revenue is gradually ceding mix toward recurring software subscriptions. Services bridge the gap; migration tooling, AI model optimization, and compliance audits command premium rates that elevate average deal value without inflating capital budgets. As buyers pursue cloud-like flexibility on-prem, the hyper-converged infrastructure market size attached to software subscriptions will continue compounding above overall growth.
In 2025, professional services accounted for 64.98% of total revenue. However, managed services are on the rise, boasting a 17.88% CAGR, underscoring the growing preference of SMBs for pay-as-you-go operations. This trend highlights the increasing demand for flexible and scalable solutions that align with the operational needs of small and medium-sized businesses. HPE's GreenLake achieved a notable USD 1.6 billion in revenue for Q4 FY2024, with hyper-converged nodes contributing to 35% of this figure. This performance reflects the growing adoption of hyper-converged infrastructure solutions as businesses seek to optimize their IT environments.
Managed-service providers offer a suite of services, including patching, capacity telemetry, and disaster recovery, charging between USD 500 to 2,000 monthly per node. This approach transforms unpredictable capital expenditures into consistent operational expenses, providing businesses with greater financial predictability and control. Royal Farms, with its deployment across 260 stores, successfully eliminated the need for on-site technicians, resulting in annual savings of USD 1.8 million. This case study exemplifies the cost-saving potential of managed services for enterprises with distributed operations. With the maturation of remote management APIs, the hyper-converged infrastructure sector is shifting its focus. Instead of relying solely on one-time appliance gross margins, the industry is now leaning towards annuity revenue, a move that significantly boosts vendor valuation multiples. This transition not only enhances revenue stability for vendors but also aligns with the evolving needs of customers seeking long-term value and support.
The Hyper-Converged Infrastructure Market Report is Segmented by Component (Hardware, Software, and Services), Service (Professional, and Managed), Organization Size (Large Enterprise, and Small and Medium Enterprise), End-User Industry (IT and Telecommunication, BFSI, Healthcare, Retail, Government and Defence, and More), and Geography. The Market Forecasts are Provided in Terms of Value (USD).
Geography Analysis
In 2025, North America accounted for 39.93% of global revenue, driven by U.S. federal zero-trust mandates and the establishment of hyperscaler edge hubs, with Verizon operating 1,000 low-latency sites. These mandates and hubs have significantly contributed to the region's dominance in the hyper-converged infrastructure market. Meanwhile, Canada's stringent data-sovereignty laws compel banks and hospitals to manage workloads on-premises, albeit under cloud-native governance frameworks. This regulatory environment has led to a sustained premium demand for hyper-converged infrastructure solutions, even in the face of rising borrowing costs, as organizations prioritize compliance and operational efficiency.
Asia-Pacific is on an upward trajectory, boasting an 18.69% CAGR. The region's growth is fueled by China's focus on developing indigenous virtualization stacks, India's efforts to modernize its telecommunications cores, and Japan's initiatives to automate factories through private 5G networks. Notably, Huawei's FusionCube is at the forefront of Chinese state projects, showcasing its dominance in the market. Similarly, Reliance Jio has expanded Nutanix across 10,000 towers, demonstrating India's commitment to scaling its telecommunications infrastructure. Additionally, Toyota has integrated Fujitsu's PRIMEFLEX into its assembly plants, highlighting Japan's focus on leveraging advanced technologies for industrial automation. This diverse multi-vendor landscape in the region not only accelerates innovation but also heightens the barriers to switching vendors, creating a competitive and dynamic market environment.
Europe grapples with 7-10 year grid queues in its FLAP-D metropolitan areas, which include Frankfurt, London, Amsterdam, Paris, and Dublin. This challenge is steering buyers towards more power-efficient ARM or RISC-V nodes and fostering co-location partnerships to mitigate energy constraints. Germany, driven by its robust automotive AI initiatives, represents 28% of the region's spending, underscoring its leadership in adopting advanced technologies. France, on the other hand, is capitalizing on its nuclear baseload energy to attract sovereign-cloud workloads, positioning itself as a key player in the market. While Nordic regions are drawing hyperscale attention with hydro and waste-heat recycling initiatives, rising tariffs are still curbing the hyper-converged infrastructure market's CAGR in the continent by 0.7%. These factors collectively shape Europe's market dynamics, presenting both opportunities and challenges for stakeholders.
- Nutanix Inc.
- Dell Technologies Inc.
- VMware Inc.
- Hewlett Packard Enterprise Development LP
- Cisco Systems Inc.
- Microsoft Corporation
- Huawei Technologies Co. Ltd.
- IBM Corporation
- NetApp Inc.
- Lenovo Group Limited
- Fujitsu Limited
- Hitachi Vantara LLC
- NEC Corporation
- Super Micro Computer Inc.
- Scale Computing Inc.
- StarWind Software Inc.
- DataCore Software Corporation
- Maxta Inc.
- Pivot3 Inc.
- Sangfor Technologies Inc.
Additional Benefits:
- The market estimate (ME) sheet in Excel format
- 3 months of analyst support
TABLE OF CONTENTS
1 INTRODUCTION
- 1.1 Study Assumptions and Market Definition
- 1.2 Scope of the Study
2 RESEARCH METHODOLOGY
3 EXECUTIVE SUMMARY
4 MARKET LANDSCAPE
- 4.1 Market Overview
- 4.2 Market Drivers
- 4.2.1 Data-center Consolidation Wave
- 4.2.2 Surging Cloud-native Workload Adoption
- 4.2.3 Lower TCO Versus Legacy Three-tier Architecture
- 4.2.4 Edge Computing Roll-outs in Telco and Retail
- 4.2.5 RISC-V and ARM Based HCI Appliances
- 4.2.6 Modular Data-center Demand in Emerging Africa
- 4.3 Market Restraints
- 4.3.1 Per-node Scalability Ceiling for High-end Workloads
- 4.3.2 Vendor Lock-in Concerns for Enterprise Buyers
- 4.3.3 Supply Chain Risk Around Custom ASICs
- 4.3.4 Escalating Datacenter Power Tariffs in Europe
- 4.4 Industry Value-Chain Analysis
- 4.5 Regulatory Landscape
- 4.6 Technological Outlook
- 4.7 Porter's Five Forces Analysis
- 4.7.1 Bargaining Power of Buyers
- 4.7.2 Bargaining Power of Suppliers
- 4.7.3 Threat of New Entrants
- 4.7.4 Threat of Substitutes
- 4.7.5 Competitive Rivalry
5 MARKET SIZE AND GROWTH FORECASTS (VALUE)
- 5.1 By Component
- 5.1.1 Hardware
- 5.1.2 Software
- 5.1.3 Services
- 5.2 By Service
- 5.2.1 Professional
- 5.2.2 Managed
- 5.3 By Organization Size
- 5.3.1 Large Enterprise
- 5.3.2 Small and Medium Enterprise
- 5.4 By End-user Industry
- 5.4.1 IT and Telecommunication
- 5.4.2 BFSI
- 5.4.3 Healthcare
- 5.4.4 Retail
- 5.4.5 Government and Defence
- 5.4.6 Rest of End-user Industry
- 5.5 By Geography
- 5.5.1 North America
- 5.5.1.1 United States
- 5.5.1.2 Canada
- 5.5.1.3 Mexico
- 5.5.2 South America
- 5.5.2.1 Brazil
- 5.5.2.2 Argentina
- 5.5.2.3 Rest of South America
- 5.5.3 Europe
- 5.5.3.1 Germany
- 5.5.3.2 United Kingdom
- 5.5.3.3 France
- 5.5.3.4 Italy
- 5.5.3.5 Spain
- 5.5.3.6 Rest of Europe
- 5.5.4 Asia-Pacific
- 5.5.4.1 China
- 5.5.4.2 India
- 5.5.4.3 Japan
- 5.5.4.4 South Korea
- 5.5.4.5 Australia and New Zealand
- 5.5.4.6 Rest of Asia-Pacific
- 5.5.5 Middle East
- 5.5.5.1 Saudi Arabia
- 5.5.5.2 United Arab Emirates
- 5.5.5.3 Turkey
- 5.5.5.4 Rest of Middle East
- 5.5.6 Africa
- 5.5.6.1 South Africa
- 5.5.6.2 Nigeria
- 5.5.6.3 Egypt
- 5.5.6.4 Rest of Africa
- 5.5.1 North America
6 COMPETITIVE LANDSCAPE
- 6.1 Market Concentration
- 6.2 Strategic Moves
- 6.3 Market Share Analysis
- 6.4 Company Profiles (includes Global Level Overview, Market Level Overview, Core Segments, Financials as available, Strategic Information, Market Rank/Share, Products and Services, Recent Developments)
- 6.4.1 Nutanix Inc.
- 6.4.2 Dell Technologies Inc.
- 6.4.3 VMware Inc.
- 6.4.4 Hewlett Packard Enterprise Development LP
- 6.4.5 Cisco Systems Inc.
- 6.4.6 Microsoft Corporation
- 6.4.7 Huawei Technologies Co. Ltd.
- 6.4.8 IBM Corporation
- 6.4.9 NetApp Inc.
- 6.4.10 Lenovo Group Limited
- 6.4.11 Fujitsu Limited
- 6.4.12 Hitachi Vantara LLC
- 6.4.13 NEC Corporation
- 6.4.14 Super Micro Computer Inc.
- 6.4.15 Scale Computing Inc.
- 6.4.16 StarWind Software Inc.
- 6.4.17 DataCore Software Corporation
- 6.4.18 Maxta Inc.
- 6.4.19 Pivot3 Inc.
- 6.4.20 Sangfor Technologies Inc.
7 MARKET OPPORTUNITIES AND FUTURE OUTLOOK
- 7.1 White-Space and Unmet-Need Assessment

