
PUBLISHER: Mordor Intelligence | PRODUCT CODE: 2044215

PUBLISHER: Mordor Intelligence | PRODUCT CODE: 2044215
Conversational Systems - Market Share Analysis, Industry Trends & Statistics, Growth Forecasts (2026 - 2031)
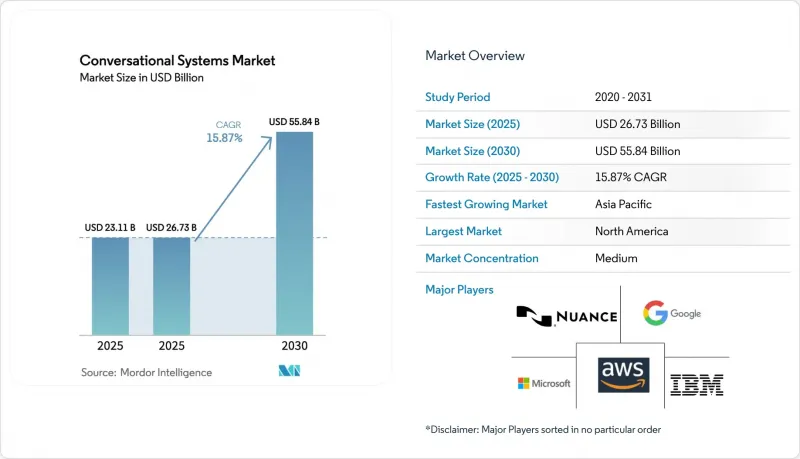
The conversational systems market size is projected to be USD 23.11 billion in 2025, USD 26.73 billion in 2026, and reach USD 55.84 billion by 2031, growing at a CAGR of 15.87% from 2026 to 2031.
Demand inflects upward as generative AI inference costs fall below the economic threshold for mid-market enterprises, making automation viable outside the early-adopter hyperscalers. Enterprises are replacing rule-based chatbots with large-language-model orchestration that understands natural language at scale, avoids brittle decision trees, and accelerates resolution speed. Cloud-hosted deployments continue to dominate but data-sovereignty laws in the European Union, India, and China are catalyzing a pivot to edge and hybrid topologies that process sensitive customer data locally. Competitive intensity is rising as hyperscalers embed conversational capabilities inside wider cloud agreements, while open-source agent frameworks empower internal developer teams to build proprietary workflows without vendor lock-in.
Global Conversational Systems Market Trends and Insights
Soaring API-Based Integrations Across CX Tech Stacks
API-first architectures convert conversational AI from a single channel into the connective tissue of customer-experience platforms, unifying voice, chat, email, and social media workflows. MuleSoft recorded an average of 47 application-programming-interface integrations per conversational deployment in 2025, more than double the 2023 figure, which enabled agents to pull context from customer-relationship-management, order-management, and billing systems without screen toggling. Denser integration trimmed average handle times by up to 40% and improved net promoter scores in banking and telecom where churn closely tracks first-contact resolution. Contentstack found 68% of enterprises adopting headless content-management systems that expose data via GraphQL, letting conversational agents dynamically compose responses rather than referencing static FAQs. Buyers now rank out-of-the-box connectors above individual feature breadth, accelerating consolidation toward platforms able to orchestrate heterogeneous CX stacks.
Generative-AI Cost Curve Collapse Enabling SME Adoption
Between January 2024 and December 2025, per-token prices for GPT-4-class models fell 78% as NVIDIA's H200 GPUs, transformer quantization, and hyperscaler price wars pushed costs to USD 0.0004. The new threshold makes deployments profitable for firms handling fewer than 50,000 monthly interactions, a tier previously locked out by infrastructure overhead. AWS Bedrock reported 340% year-on-year SME uptake in 2025 after serverless inference removed the need for dedicated clusters. Distilled models such as Microsoft Phi-3 deliver GPT-3.5-level quality at one-tenth the inference cost and run on 4 GB edge devices, letting regional integrators bundle turnkey vertical solutions for price-sensitive clients. This democratization is redrawing competitive lines as local providers in Asia Pacific and South America embed local-language models and compliance templates into subscription bundles.
Rising LLM Inference Costs at Scale
Although unit economics have improved, enterprises processing millions of daily interactions face monthly inference bills that can exceed USD 2.8 million, eroding labor-savings gains. Stateful, memory-rich conversations consume four to seven times the GPU cycles of single-turn queries, and optimization tactics such as prompt caching or quantization introduce latency that jeopardizes voice-channel abandonment thresholds. For price-sensitive sectors like hospitality, unpredictable query spikes can make automation more expensive than human handling, tempering near-term uptake.
Other drivers and restraints analyzed in the detailed report include:
- Contact-Center Automation Mandates in BFSI and Telecom
- Shift From Uni-Modal to Multimodal (Voice-Text-Vision)
- Accuracy and Hallucination Risk in Regulated Verticals
For complete list of drivers and restraints, kindly check the Table Of Contents.
Segment Analysis
Uni-modal text chatbots retained the largest 2025 revenue slice at 51.74%, a legacy of early deployments tuned for messaging apps and email queues. However, multimodal platforms are scaling at 15.92% CAGR as enterprises move complex support and telehealth use cases to agents that interpret speech, text, and images in the same session. Microsoft's addition of GPT-4 Vision to Dynamics 365 Customer Service lowered escalation rates by 38% during electronics-retail pilots. Edge processing and regulatory privacy mandates encourage multimodal inference on-device, reducing latency from 800 ms to 120 ms on Qualcomm's AI-optimized chipsets.
Cost-sensitive workflows continue to favor uni-modal text where bandwidth, compute, and compliance requirements stay minimal. Yet as smartphone cameras and 5G networks proliferate in Asia Pacific and Africa, the value of visual context climbs, widening the addressable base for multimodal solutions. Vendors prioritizing unified application-programming-interfaces that abstract vision encoders, speech-to-text, and language models will outpace point products that bolt modalities together. The conversational systems market will see multimodal architectures become the design default by the late forecast horizon.
Text-assisted interfaces accounted for 55.92% revenue in 2025, reflecting entrenched web-chat and messaging bots that deflect phone calls. Voice-assisted systems sit mid-pack, automating call centers and smart-speaker dialogs. Generative multimodal agents, though nascent, are advancing at 15.98% CAGR as enterprises abandon scripted decision trees for open-ended reasoning that manages order changes, billing disputes, or insurance claims without human takeover. Salesforce pilots logged a 52% cut in average handle time on complex order-modification cases after embedding generative agents inside Service Cloud.
Voice channels face compliance headwinds from deep-fake concerns, prompting the Federal Communications Commission to draft 2026 authentication mandates that could raise implementation costs. Text remains a lower-cost, audit-friendly option because logs furnish clear evidence trails. Generative multimodal agents bridge the divide, accepting voice for accessibility, text for clarity, and images for confirmation, all within a single engagement. As pay-per-interaction pricing aligns costs with outcomes, the conversational systems market will migrate toward interface flexibility rather than modality silos.
The Conversational Systems Market Report is Segmented by Modality Type (Uni-Modal and Multi-Modal), Interface Type (Voice-Assisted, Text-Assisted, and More), Deployment (On-Premises, Cloud-Hosted, and More), Enterprise Size (Small and Medium Enterprises and Large Enterprises), End-User Vertical (BFSI, Healthcare, IT and Telecommunications, and More), and Geography. The Market Forecasts are Provided in Terms of Value (USD).
Geography Analysis
Asia Pacific leads the growth trajectory with a 16.17% CAGR to 2031 as India's Digital India credits, Japan's elder-care subsidies, and China's Baidu-led language-model expansion converge to scale local adoption. The conversational systems market size for Asia Pacific is rapidly climbing as smartphone penetration brings multimodal access to rural regions previously served by SMS. Local-language models in Hindi, Mandarin, Bahasa Indonesia, and Vietnamese remove the English-centric barrier, while government mandates require citizen-facing agencies to digitize service desks.
North America remains the revenue anchor at a 38.51% conversational systems market share in 2025, buoyed by early BFSI and telecom rollouts and proximity to foundation-model research centers. Regulatory specificity, such as the FDA pathway for medical chatbots and clear CFPB customer-service rules, provides adoption clarity that supports steady enterprise investment. Hyperscalers headquartered in the United States leverage integrated cloud offerings, compressing procurement cycles for indigenous enterprises.
Europe sustains measured expansion amid the AI Act's transparency rules that raise documentation costs 15-25%. Yet the region benefits from deep technical talent and strong public-sector demand for multilingual interfaces serving cross-border constituencies. Middle East and Africa plus South America present emerging opportunities as Saudi Arabia's Vision 2030 earmarks USD 20 billion for AI infrastructure and Brazil and Mexico deploy conversational banking to reach unbanked populations. Vendors tailoring compliance frameworks to regional statutes and embedding local-language support will outperform generic solutions.
- Microsoft
- Google LLC (Alphabet)
- Amazon Web Services
- IBM Corporation
- Anthropic
- Cohere
- OpenAI
- Salesforce Inc.
- Meta Platforms
- Baidu
- Nuance Communications
- Kore.ai
- LivePerson
- ServiceNow
- Zendesk
- Twilio
- NICE
- Ada Support
- Yellow.ai
- Rasa Technologies
Additional Benefits:
- The market estimate (ME) sheet in Excel format
- 3 months of analyst support
TABLE OF CONTENTS
1 INTRODUCTION
- 1.1 Study Assumptions and Market Definition
- 1.2 Scope of the Study
2 RESEARCH METHODOLOGY
3 EXECUTIVE SUMMARY
4 MARKET LANDSCAPE
- 4.1 Market Overview
- 4.2 Market Drivers
- 4.2.1 Soaring API-Based Integrations Across CX Tech Stacks
- 4.2.2 Generative-AI Cost Curve Collapse Enabling SME Adoption
- 4.2.3 Contact-Center Automation Mandates In BFSI and Telecom
- 4.2.4 Shift From Uni-Modal To Multimodal (Voice-Text-Vision)
- 4.2.5 Edge-Deployed Private LLMs To Meet Data-Sovereignty Laws
- 4.2.6 Exploding Open-Source LLM Agent Frameworks (Autogen, Langchain)
- 4.3 Market Restraints
- 4.3.1 Rising LLM Inference Costs at Scale
- 4.3.2 Accuracy and Hallucination Risk In Regulated Verticals
- 4.3.3 Synthetic-Voice Deep-Fake Compliance Pressure
- 4.3.4 AI-Carbon-Footprint Disclosure Rules (EU CSRD)
- 4.4 Value Chain Analysis
- 4.5 Regulatory Landscape
- 4.6 Porter's Five Forces
- 4.6.1 Threat of New Entrants
- 4.6.2 Bargaining Power of Buyers
- 4.6.3 Bargaining Power of Suppliers
- 4.6.4 Threat of Substitutes
- 4.6.5 Competitive Rivalry
5 MARKET SIZE and GROWTH FORECASTS (VALUE)
- 5.1 By Modality Type
- 5.1.1 Uni-modal
- 5.1.2 Multimodal
- 5.2 By Interface Type
- 5.2.1 Voice-assisted
- 5.2.2 Text-assisted
- 5.2.3 Generative multimodal agents
- 5.3 By Deployment
- 5.3.1 On-premise
- 5.3.2 Cloud-hosted
- 5.3.3 Edge / Device-level
- 5.4 By Enterprise Size
- 5.4.1 Small and Medium Enterprises (SMEs)
- 5.4.2 Large Enterprises
- 5.5 By End-User Vertical
- 5.5.1 IT and Telecommunication
- 5.5.2 BFSI
- 5.5.3 Government and Public Sector
- 5.5.4 Retail and E-commerce
- 5.5.5 Healthcare
- 5.5.6 Energy and Utilities
- 5.5.7 Travel and Hospitality
- 5.5.8 Other End-User Verticals
- 5.6 By Geography
- 5.6.1 North America
- 5.6.1.1 United States
- 5.6.1.2 Canada
- 5.6.1.3 Mexico
- 5.6.2 South America
- 5.6.2.1 Brazil
- 5.6.2.2 Argentina
- 5.6.2.3 Rest of South America
- 5.6.3 Europe
- 5.6.3.1 Germany
- 5.6.3.2 United Kingdom
- 5.6.3.3 France
- 5.6.3.4 Italy
- 5.6.3.5 Spain
- 5.6.3.6 Rest of Europe
- 5.6.4 Asia Pacific
- 5.6.4.1 China
- 5.6.4.2 Japan
- 5.6.4.3 India
- 5.6.4.4 South Korea
- 5.6.4.5 Rest of Asia Pacific
- 5.6.5 Middle East
- 5.6.5.1 Saudi Arabia
- 5.6.5.2 United Arab Emirates
- 5.6.5.3 Rest of Middle East
- 5.6.6 Africa
- 5.6.6.1 South Africa
- 5.6.6.2 Nigeria
- 5.6.6.3 Egypt
- 5.6.6.4 Rest of Africa
- 5.6.1 North America
6 COMPETITIVE LANDSCAPE
- 6.1 Market Concentration
- 6.2 Strategic Moves
- 6.3 Market Share Analysis
- 6.4 Company Profiles (includes Global level Overview, Market level overview, Core Segments, Financials as available, Strategic Information, Market Rank/Share for key companies, Products and Services, and Recent Developments)
- 6.4.1 Microsoft
- 6.4.2 Google LLC (Alphabet)
- 6.4.3 Amazon Web Services
- 6.4.4 IBM Corporation
- 6.4.5 Anthropic
- 6.4.6 Cohere
- 6.4.7 OpenAI
- 6.4.8 Salesforce Inc.
- 6.4.9 Meta Platforms
- 6.4.10 Baidu
- 6.4.11 Nuance Communications
- 6.4.12 Kore.ai
- 6.4.13 LivePerson
- 6.4.14 ServiceNow
- 6.4.15 Zendesk
- 6.4.16 Twilio
- 6.4.17 NICE
- 6.4.18 Ada Support
- 6.4.19 Yellow.ai
- 6.4.20 Rasa Technologies
7 MARKET OPPORTUNITIES AND FUTURE OUTLOOK
- 7.1 White-space and Unmet-need Assessment

