PUBLISHER: Mordor Intelligence | PRODUCT CODE: 2044221

PUBLISHER: Mordor Intelligence | PRODUCT CODE: 2044221
Ultra Wideband - Market Share Analysis, Industry Trends & Statistics, Growth Forecasts (2026 - 2031)
The Ultra-Wideband market size was valued at USD 1.23 billion in 2025 and estimated to grow from USD 1.54 billion in 2026 to reach USD 3.81 billion by 2031, at a CAGR of 19.86% during the forecast period (2026-2031).
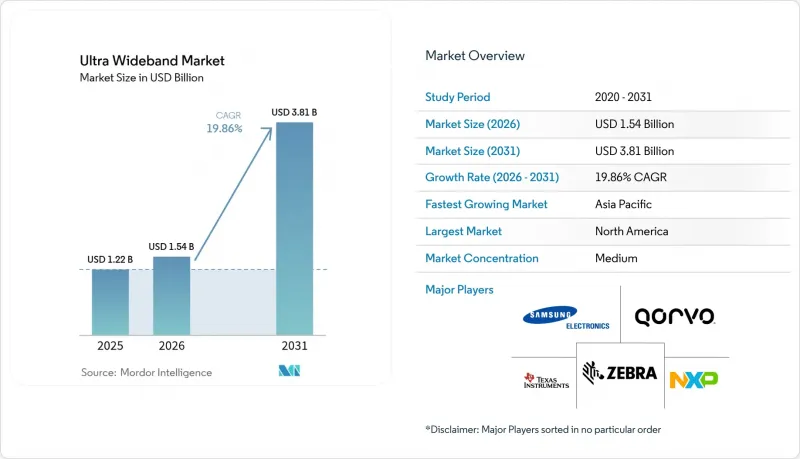
Centimeter-level positioning accuracy is shifting the technology from smartphone novelty to an indispensable layer in Industry 4.0 automation, port logistics, and relay-attack-resistant digital keys. Manufacturers observed a 30%-40% drop in forklift-collision insurance claims after adopting sub-10-centimeter asset tracking, while fleet-leasing insurers cut premiums by up to 12% for vehicles fitted with UWB-based passive-entry systems. Regulatory momentum, notably European Union Decision 2024/1467 and China MIIT rules, doubled permissible outdoor range and removed provincial certification delays, creating an incentive for large-scale infrastructure rollouts. Meanwhile, BLE angle-of-arrival systems now reach 50-centimeter precision at one-third of UWB silicon cost, positioning cost as the main competitive battleground rather than raw accuracy. Chip supply below 28 nanometers remains tight because foundries prioritize higher-margin smartphone processors, extending module lead times to 18 weeks and forcing chipmakers to secure alternative capacity or migrate to finer geometries.
Global Ultra Wideband Market Trends and Insights
Explosive RTLS Demand Across Industry 4.0 Plants
Automotive and discrete-parts manufacturers documented 18%-25% cuts in work-in-progress inventory after replacing barcode scans with UWB anchors that integrate directly into SAP manufacturing execution systems, triggering pallet delivery within 90 seconds. German suppliers alone deployed anchors across 1.2 million m2 of floor space in 2025. Japanese electronics assemblers extended UWB to collaborative-robot safety zones where IEEE 802.15.4z secure ranging prevents spoofed emergency-stop overrides. Module price erosion to below USD 3.50 at 10,000-unit volumes removed a key cost barrier, and South Korean semiconductor fabs are piloting cleanroom tool tracking to avert process-bay misrouting. The result is a structural transition from proof-of-concept to enterprise-wide adoption across global factory networks.
Smartphone OEM Mandate for Spatial-Awareness Features
Apple shipped iPhones with UWB across its entire 2025 lineup, enabling precise AirTag finding, spatial audio head-tracking, and relay-attack-resistant payments. Samsung followed with Galaxy S25 Ultra and Z Fold 6, and Xiaomi's 15S Pro paired UWB with digital keys for BYD and NIO vehicles. Insurers responded by offering 5%-8% discounts on devices carrying UWB secure-ranging chips, catalysing demand in premium-tier smartphones. Google added UWB commissioning to Android 15's Matter-compliant smart-home setup, shortening onboarding time by 40% in beta trials. Interoperability pressure from FiRa Consortium profiles made cross-brand compatibility table stakes for any flagship handset.
BLE AoA/AoD Cost Advantage Under 50 cm Accuracy
Bluetooth direction-finding modules priced near USD 1.20 achieved sub-50-centimeter precision inside retail stores, giving budget-conscious operators a viable alternative to UWB. Hospitals tracking tens of thousands of assets save USD 2 per tag, translating into six-figure capital savings. Retail pilots in 2025 confirmed BLE sufficiency for aisle-level inventory searches, with UWB justified only for theft prevention. Bluetooth SIG's 6.0 roadmap narrows the accuracy gap to 20 centimeters, intensifying price pressure. UWB suppliers now emphasize secure ranging and relay-attack resistance, benefits that resonate in automotive and finance but less so in horizontal markets.
Other drivers and restraints analyzed in the detailed report include:
- Regulatory Green-Lights for Sub-GHz UWB in Europe and Asia-Pacific
- Automotive Shift to Digital Keys and In-Cabin Radar
- Chip Supply Bottlenecks Below 28 nm
For complete list of drivers and restraints, kindly check the Table Of Contents.
Segment Analysis
Ultra-wideband market size momentum rests on hardware dominance, yet enterprises increasingly outsource network calibration and firmware updates, driving services toward a 20.22% CAGR through 2031. Facilities installing 200-500 anchors across multiple buildings learned that predictive propagation models fail to capture metal racks and conveyor belts, requiring on-site tuning that often costs USD 50,000-USD 150,000 per plant. Hardware price erosion is rapid; DW3000 module costs fell 40% between 2023 and 2025, putting pressure on margins.
Software's mid-teens slice translates raw coordinates into business triggers such as AGV dispatch, while antenna innovation from fractal and ceramic designs trims footprint 50%, enabling smartwatch and earbud use cases. Modules that bundle chips, antennas, and power management now cut certification time in half. Recurring maintenance contracts, typically 12%-18% of deployment cost, secure predictable cash flows for integrators.
Smart-building deployments propel the ultra-wideband market as LEED Platinum retrofits demand occupancy sensing to optimize HVAC loads. Commercial landlords reported 20%-30% space-utilization gains, postponing costly expansions. Consumer electronics led 2025 revenue at 27.42%, yet its growth is plateauing as UWB becomes a standard flagship feature.
Secure ranging prevents badge cloning, making UWB access control the default choice in high-security facilities. Automotive and logistics maintain double-digit share via digital keys and vehicle-to-infrastructure positioning, while healthcare tracks infusion pumps and wheelchairs to reduce loss write-offs. Recurring analytics fees bolster smart-building margins, supporting continued investment even as hardware commoditizes.
The Ultra Wideband Market Report is Segmented by Component (Hardware, Software, and Services), End-User Vertical (Consumer Electronics, Automotive and Transportation, and More), Device Type (Smartphones, and More), Frequency Band (3. 1-4. 8 GHz, and 6-10. 6 GHz), Range Capability (Short-Range, and More), Application (RTLS, Secure Digital Keys, and More), and Geography. Market Forecasts are Provided in Terms of Value (USD).
Geography Analysis
North America accounted for 36.93% of 2025 revenue, with United States insurers granting 8%-12% fleet-premium cuts for UWB digital-key vehicles and factories covering 15 million ft2 with anchors. Canada lagged due to delayed spectrum allocation, corrected only in January 2026, while Mexico's nearshoring boom deployed RTLS from day one. Cost-sensitive verticals lean toward BLE, and semiconductor shortages exacerbate automotive wait times.
Asia-Pacific is forecast to register a 21.01% CAGR, the fastest globally. China's unified 7163-8812 MHz rules shortened smartphone approval cycles to eight weeks, and flagship phones paired UWB with EV digital keys. Japan's 2024 ARIB update enabled 50,000 daily UWB payments at Tokyo metro stations starting March 2026. South Korea's rule harmonization let Samsung launch UWB-enabled Galaxy S25 Ultra without extra certification. India and most of Southeast Asia remain early-stage due to price sensitivity, though Singapore and Kuala Lumpur pilots improved pedestrian flow 30%-40%. Australia and New Zealand mirrored EU standards, easing mining-sector adoption.
Europe captured a mid-twenties share in 2025 thanks to Decision 2024/1467 that opened outdoor use and raised power limits. Germany leads with automotive mandates and 8 million ft2 of RTLS-equipped plants. France and United Kingdom face dual certification, slowing market entry by up to 12 weeks. Spain and Italy focus on temperature-controlled pharma logistics, while Russia's access to advanced chipsets is limited by trade restrictions. GCC ports in Dubai and Abu Dhabi piloted 20-centimeter container tracking, whereas African adoption is nascent, with South Africa trailing mining safety programs.
- Apple Inc.
- Qorvo Inc.
- NXP Semiconductors NV
- Zebra Technologies Corp.
- Texas Instruments Inc.
- Samsung Electronics Co. Ltd.
- Sony Group Corporation
- STMicroelectronics NV
- Infineon Technologies AG
- Qualcomm Inc.
- Broadcom Inc.
- Pulse-Link Inc.
- Humatics Corp.
- Alereon Inc.
- Fractus SA
- Johanson Technology Inc.
- BeSpoon SAS
- Sewio Networks s.r.o.
- Decawave Ltd. (Qorvo)
- Nanotron Technologies GmbH
- Ubisense Ltd.
- Murata Manufacturing Co. Ltd.
Additional Benefits:
- The market estimate (ME) sheet in Excel format
- 3 months of analyst support
TABLE OF CONTENTS
1 INTRODUCTION
- 1.1 Study Assumptions and Market Definition
- 1.2 Scope of the Study
2 RESEARCH METHODOLOGY
3 EXECUTIVE SUMMARY
4 MARKET LANDSCAPE
- 4.1 Market Overview
- 4.2 Market Drivers
- 4.2.1 Explosive RTLS Demand Across Industry 4.0 Plants
- 4.2.2 Smartphone OEM Mandate for Spatial-Awareness Features
- 4.2.3 Regulatory Green-Lights for Sub-GHz UWB in Europe and Asia-Pacific
- 4.2.4 Automotive Shift to Digital Keys and In-Cabin Radar
- 4.2.5 Open-Source UWB Firmware Lowering Entry Barriers
- 4.2.6 National Infrastructure Funding for Smart Ports and Airports
- 4.3 Market Restraints
- 4.3.1 BLE AoA/AoD Cost Advantage Under 50 cm Accuracy
- 4.3.2 Chip Supply Bottlenecks Below 28 nm
- 4.3.3 Fragmented Regional Spectrum Rules Slowing Certification
- 4.3.4 Sophisticated Micro-Location Spoofing and Side-Channel Attacks
- 4.4 Industry Value-Chain Analysis
- 4.5 Regulatory Landscape
- 4.6 Technological Outlook
- 4.7 Porter's Five Forces Analysis
- 4.7.1 Bargaining Power of Suppliers
- 4.7.2 Bargaining Power of Buyers
- 4.7.3 Threat of New Entrants
- 4.7.4 Threat of Substitute Products
- 4.7.5 Intensity of Competitive Rivalry
- 4.8 Impact of Macroeconomic Factors on the Market
5 MARKET SIZE AND GROWTH FORECASTS (VALUE)
- 5.1 By Component
- 5.1.1 Hardware
- 5.1.1.1 ICs/Chipsets
- 5.1.1.2 Antennas
- 5.1.1.3 Modules
- 5.1.2 Software
- 5.1.3 Services
- 5.1.1 Hardware
- 5.2 By End-User Vertical
- 5.2.1 Consumer Electronics
- 5.2.2 Automotive and Transportation
- 5.2.3 Healthcare
- 5.2.4 Manufacturing and Industrial
- 5.2.5 Retail and Warehousing
- 5.2.6 Defense and Public Safety
- 5.2.7 Smart Buildings
- 5.3 By Device Type
- 5.3.1 Smartphones
- 5.3.2 Wearables and Hearables
- 5.3.3 Vehicles
- 5.3.4 Drones and Robots
- 5.3.5 Fixed Infrastructure (Gateways, Beacons)
- 5.4 By Frequency Band
- 5.4.1 3.1-4.8 GHz
- 5.4.2 6-10.6 GHz
- 5.5 By Range Capability
- 5.5.1 Short-Range (Less than 10 m)
- 5.5.2 Mid-Range (10-30 m)
- 5.5.3 Long-Range (More than 30 m)
- 5.6 By Application
- 5.6.1 Real-Time Location Systems (RTLS)
- 5.6.2 Secure Digital Keys
- 5.6.3 Augmented and Virtual Reality (AR/VR) Mapping
- 5.6.4 Asset Tracking and Inventory Management
- 5.6.5 Smart Home and Building Automation
- 5.7 By Geography
- 5.7.1 North America
- 5.7.1.1 United States
- 5.7.1.2 Canada
- 5.7.1.3 Mexico
- 5.7.2 South America
- 5.7.2.1 Brazil
- 5.7.2.2 Rest of South America
- 5.7.3 Europe
- 5.7.3.1 Germany
- 5.7.3.2 France
- 5.7.3.3 United Kingdom
- 5.7.3.4 Italy
- 5.7.3.5 Spain
- 5.7.3.6 Russia
- 5.7.3.7 Rest of Europe
- 5.7.4 Asia-Pacific
- 5.7.4.1 China
- 5.7.4.2 Japan
- 5.7.4.3 South Korea
- 5.7.4.4 India
- 5.7.4.5 Australia and New Zealand
- 5.7.4.6 Southeast Asia
- 5.7.4.7 Rest of Asia-Pacific
- 5.7.5 Middle East
- 5.7.5.1 GCC
- 5.7.5.2 Turkey
- 5.7.5.3 Rest of Middle East
- 5.7.6 Africa
- 5.7.6.1 South Africa
- 5.7.6.2 Rest of Africa
- 5.7.1 North America
6 COMPETITIVE LANDSCAPE
- 6.1 Market Concentration
- 6.2 Strategic Moves
- 6.3 Market Share Analysis
- 6.4 Company Profiles (includes Global Level Overview, Market Level Overview, Core Segments, Financials as available, Strategic Information, Market Rank/Share, Products and Services, Recent Developments)
- 6.4.1 Apple Inc.
- 6.4.2 Qorvo Inc.
- 6.4.3 NXP Semiconductors NV
- 6.4.4 Zebra Technologies Corp.
- 6.4.5 Texas Instruments Inc.
- 6.4.6 Samsung Electronics Co. Ltd.
- 6.4.7 Sony Group Corporation
- 6.4.8 STMicroelectronics NV
- 6.4.9 Infineon Technologies AG
- 6.4.10 Qualcomm Inc.
- 6.4.11 Broadcom Inc.
- 6.4.12 Pulse-Link Inc.
- 6.4.13 Humatics Corp.
- 6.4.14 Alereon Inc.
- 6.4.15 Fractus SA
- 6.4.16 Johanson Technology Inc.
- 6.4.17 BeSpoon SAS
- 6.4.18 Sewio Networks s.r.o.
- 6.4.19 Decawave Ltd. (Qorvo)
- 6.4.20 Nanotron Technologies GmbH
- 6.4.21 Ubisense Ltd.
- 6.4.22 Murata Manufacturing Co. Ltd.
7 MARKET OPPORTUNITIES AND FUTURE OUTLOOK
- 7.1 White-Space and Unmet-Need Assessment

