
PUBLISHER: Mordor Intelligence | PRODUCT CODE: 2044233

PUBLISHER: Mordor Intelligence | PRODUCT CODE: 2044233
LEO Satellite - Market Share Analysis, Industry Trends & Statistics, Growth Forecasts (2026 - 2031)
The LEO satellite market size is expected to grow from USD 28.81 billion in 2025 to USD 32.59 billion in 2026 and is forecast to reach USD 50.96 billion by 2031 at 9.36% CAGR over 2026-2031.
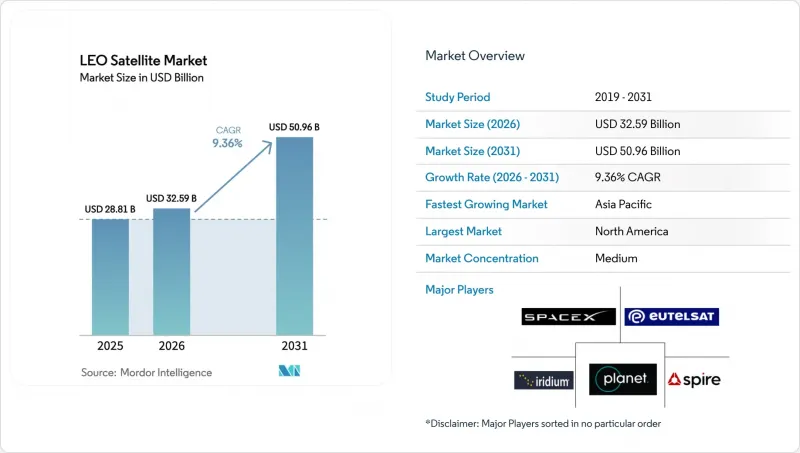
Solid subscriber growth for Constellation Broadband, new defense programs that rely on proliferated spacecraft, and declining launch costs are the dominant growth catalysts. Competition is intensifying as vertically-integrated operators prove they can monetize mass-market connectivity, which pushes prices down and accelerates adoption. Regulations are tightening on orbital debris, yet they also create demand for sustainable platforms and in-orbit services. Supply-chain localization and additive manufacturing further compress cycle times, letting newcomers enter faster and diversifying revenue streams across the LEO satellite market.
Global LEO Satellite Market Trends and Insights
Rising Demand for Global Broadband Connectivity
Constellation operators have demonstrated that low-latency satellite internet can achieve speeds exceeding 100 Mbps in rural communities and on mobile platforms. This success reshapes infrastructure plans for maritime, aviation, and emergency response agencies, as they can now operate beyond terrestrial coverage. Newly finalized 3GPP non-terrestrial network specifications enable mobile carriers to integrate satellites into 5G cores, extending revenue per user without costly tower deployments. As handset makers preload satellite messaging functions, uptake accelerates among consumers who previously ignored satellite gear. Governments support the rollout as part of digital-inclusion programs that treat broadband as a universal service obligation. These forces combine to widen addressable demand and lift service penetration across the LEO satellite market.
Surge in Government and Defense Spending on Resilient SATCOM
Military planners recognize that proliferated LEO layers add survivability because no single spacecraft becomes a critical node. The US Space Development Agency's tranche contracts seed hundreds of small satellites for secure communications and missile-warning networks at a unit price far below traditional GEO platforms. European ministries fund parallel programs such as EMISSARY and IRIS2 to secure autonomous connectivity while stimulating local industry. Rapid procurement models favor commercial-off-the-shelf buses that can be refreshed every few years, driving recurrent production orders. As allied nations harmonize standards for interoperable payloads, cross-border constellation sharing gains momentum. The resulting spending cycle grants near-term tailwinds to manufacturers across the LEO satellite market.
Escalating Space-Debris Collision Risk and Stricter Disposal Rules
Active satellites must dodge more objects as legacy spacecraft, rocket bodies, and fragments populate popular altitudes. Revised ITU and national guidelines shorten post-mission disposal deadlines, requiring operators to carry sufficient propulsion for reliable deorbiting. Compliance adds mass and cost, which can erode payload margins. Regulators are drafting monetary penalties that target non-performing spacecraft, raising financial exposure for under-capitalized ventures. Insurance premiums have already trended upward because actuarial models incorporate elevated collision probabilities. Mitigation technologies, such as drag sails and autonomous debris capture, remain in the early stages; therefore, capacity constraints may arise in the short term across the LEO satellite market.
Other drivers and restraints analyzed in the detailed report include:
- Falling Launch and Manufacturing Costs Due to Reusability
- Direct-to-Device (D2D) Standards Unlocking Mass-Market Handsets
- Spectrum-Sharing Conflicts with Terrestrial 5G/6G Incumbents
For complete list of drivers and restraints, kindly check the Table Of Contents.
Segment Analysis
Communication services accounted for 57.1% of the LEO satellite market share in 2025, validating the commercial pivot from technology demonstration to mass-market broadband. Subscriber growth surpasses 2 million households, as well as cruise ships and aircraft, that enjoy fiber-like latency. The LEO satellite market size for communication is forecast to expand at a 10.3% CAGR as multi-orbital roaming and direct-to-device messaging attract new segments. Competitive intensity rises as new fleets launch, yet cumulative throughput demand keeps capacity in rural corridors sold out. Scaling factors favor vertically-integrated players that control launch, spacecraft, and ground software, enabling rapid service updates.
Earth observation is the second-largest application, boosted by rapid-revisit imagery for crop analytics, urban planning, and climate compliance. Governments integrate real-time optical and radar feeds into disaster response, while insurers pay for high-frequency monitoring of industrial assets. Navigation augmentation in LEO enhances position accuracy to sub-meter levels in urban canyons. Space-science payloads and in-orbit manufacturing occupy a niche today but provide test beds for quantum communications and space-based solar power. As these technologies mature, they will add diverse revenue streams to the LEO satellite market.
Satellites weighing 10-100 kg captured 47.5% of the LEO satellite market in 2025, a sweet spot where standard CubeSat frames can accommodate larger solar arrays, high-gain antennas, and propulsion modules. The class benefits from rideshare launches that lift dozens of units at once, distributing launch overhead across many payloads. The sub-10 kg category leads growth at an 8.6% CAGR as universities and startups fly precursor missions to validate hardware. Pocket-Qube platforms reach developing nations with modest budgets, broadening participation.
The 100-500 kg range serves high-throughput nodes in broadband constellations, as larger solar wings feed multi-beam phased arrays. Buses weighing up to 1,000 kg carry optical links, digital channelizers, and multiple hosted payloads, trading higher launch costs for capacity that amortizes over vast subscriber pools. Projects above 1,000 kg await next-generation heavy lifters, which promise lower per-kilogram cost and relaxed fairing constraints. Automated panel folding, 3-D-printed thruster assemblies, and machine-vision quality checks streamline production lines across all mass classes, reinforcing volume economics in the LEO satellite market.
The LEO Satellite Market Report is Segmented by Application (Communication, Earth Observation, Navigation, Space Science and Tech-Demo, Others), Satellite Mass (Less Than 10 Kg, 10-100 Kg, 100-500 Kg, 500-1, 000 Kg, Greater Than 1, 000 Kg), End-User (Commercial, and More), Propulsion Technology (Electric, and More), and Geography (North America, and More). The Market Forecasts are Provided in Terms of Value (USD).
Geography Analysis
North America commanded 68.6% of the global LEO satellite market in 2025. Favorable Federal Communications Commission licensing, deep venture capital pools, and established launch pads in Florida, California, and Alaska create an end-to-end ecosystem. The US government service contracts underpin early demand for secure broadband and sensor payload hosting. Canada supplies phased-array antennas and software-defined ground gateways, further anchoring regional dominance. Momentum will persist as integrated launch-manufacturing-service models continue to iterate on hardware and pricing.
The Asia-Pacific region is the fastest-growing, with a 9.1% CAGR projected through 2031. National champions in China deploy prominent constellations under a state-led digital infrastructure mandate. India liberalized launch and frequency assignment rules, drawing private investment into satellite production clusters. Japan funds dual-use research and development that aligns civil disaster relief with defense postures, while South Korea and Australia specialize in ground-segment cybersecurity and optical terminal testbeds. Regional cooperation on spectrum and orbital-slot filings emerges to avoid mutual interference as fleets multiply.
Europe holds a roughly 15% share but is intent on achieving strategic autonomy. The IRIS2 public-private partnership funds up to 290 satellites equipped with optical inter-satellite links to secure continental routing. National agencies offer zero-debris design grants that promote green propulsion research. The Ariane 6 maiden flight restored competitive launch pricing for European customers, though volume remains lower than in the United States. Regulatory harmonization across member states aims to shorten licensing cycles, a prerequisite for scaling production - collective industrial depth positions Europe for leadership in sustainable platforms within the LEO satellite market.
The rest of the world includes Latin America, the Middle East, and Africa, where unserved connectivity zones and remote industrial operations drive demand. Operators deploy community gateways and pay-as-you-go data models to address affordability. National space agencies in Brazil and the United Arab Emirates invest in small-sat programs to build domestic talent pipelines. Africa benefits from ground-station hosting revenue and high-throughput backhaul services that leapfrog fiber limitations. These dynamics collectively expand the global footprint of the LEO satellite market.
- Space Exploration Technologies Corp.
- Eutelsat S.A.
- Planet Labs PBC
- Amazon Inc.
- Airbus SE
- Lockheed Martin Corporation
- Northrop Grumman Corporation
- Surrey Satellite Technology Limited
- GomSpace A/S
- NanoAvionics (Kongsberg Gruppen ASA)
- Thales Alenia Space (Thales and Leonardo S.p.A)
- Iridium Communications Inc.
- Spire Global, Inc.
- ICEYE
- Chang Guang Satellite Technology Co., Ltd. (CGSTL)
- Satellogic Inc.
Additional Benefits:
- The market estimate (ME) sheet in Excel format
- 3 months of analyst support
TABLE OF CONTENTS
1 INTRODUCTION
- 1.1 Study Assumptions and Market Definition
- 1.2 Scope of the Study
2 RESEARCH METHODOLOGY
3 EXECUTIVE SUMMARY AND KEY FINDINGS
4 KEY INDUSTRY TRENDS
- 4.1 Satellite Mass
- 4.2 Spending on Space Programs
5 MARKET LANDSCAPE
- 5.1 Market Overview
- 5.2 Market Drivers
- 5.2.1 Rising demand for global broadband connectivity
- 5.2.2 Surge in government and defence spending on resilient SATCOM
- 5.2.3 Falling launch and manufacturing costs due to reusability
- 5.2.4 Direct-to-device (D2D) standards unlocking mass-market handsets
- 5.2.5 Proliferation of edge/AI processing reducing down-link bandwidth
- 5.2.6 Rapid build-out of optical inter-satellite-link (OISL) mesh networks
- 5.3 Market Restraints
- 5.3.1 Escalating space-debris collision risk and stricter disposal rules
- 5.3.2 Spectrum-sharing conflicts with terrestrial 5G/6G incumbents
- 5.3.3 High terminal cost hindering adoption in low-income regions
- 5.3.4 Talent and specialized-component supply-chain shortages
- 5.4 Value Chain Analysis
- 5.5 Regulatory Landscape
- 5.6 Technological Outlook
- 5.7 Porter's Five Forces Analysis
- 5.7.1 Bargaining Power of Suppliers
- 5.7.2 Bargaining Power of Buyers
- 5.7.3 Threat of New Entrants
- 5.7.4 Threat of Substitutes
- 5.7.5 Intensity of Competitive Rivalry
6 MARKET SIZE AND GROWTH FORECASTS (VALUE)
- 6.1 By Application
- 6.1.1 Communication
- 6.1.2 Earth Observation
- 6.1.3 Navigation
- 6.1.4 Space Science and Tech-Demo
- 6.1.5 Others
- 6.2 By Satellite Mass
- 6.2.1 Less than 10 kg
- 6.2.2 10-100 kg
- 6.2.3 100-500 kg
- 6.2.4 500-1,000 kg
- 6.2.5 Greater than 1,000 kg
- 6.3 By End-User
- 6.3.1 Commercial
- 6.3.2 Government and Military
- 6.3.3 Other
- 6.4 By Propulsion Technology
- 6.4.1 Electric
- 6.4.2 Gas Based
- 6.4.3 Liquid Fuel
- 6.5 By Geography
- 6.5.1 North America
- 6.5.1.1 United States
- 6.5.1.2 Canada
- 6.5.2 Asia-Pacific
- 6.5.2.1 China
- 6.5.2.2 India
- 6.5.2.3 Japan
- 6.5.2.4 South Korea
- 6.5.2.5 Rest of the Asia-Pacific
- 6.5.3 Europe
- 6.5.3.1 France
- 6.5.3.2 Germany
- 6.5.3.3 United Kingdom
- 6.5.3.4 Rest of Europe
- 6.5.4 Rest of the World
- 6.5.4.1 Saudi Arabia
- 6.5.4.2 United Arab Emirates
- 6.5.4.3 Rest of the World
- 6.5.1 North America
7 COMPETITIVE LANDSCAPE
- 7.1 Market Concentration
- 7.2 Strategic Moves
- 7.3 Market Share Analysis
- 7.4 Company Profiles (includes Global Overview, Market Level Overview, Core Segments, Financials as Available, Strategic Information, Market Rank/Share for Key Companies, Products and Services, and Recent Developments)
- 7.4.1 Space Exploration Technologies Corp.
- 7.4.2 Eutelsat S.A.
- 7.4.3 Planet Labs PBC
- 7.4.4 Amazon Inc.
- 7.4.5 Airbus SE
- 7.4.6 Lockheed Martin Corporation
- 7.4.7 Northrop Grumman Corporation
- 7.4.8 Surrey Satellite Technology Limited
- 7.4.9 GomSpace A/S
- 7.4.10 NanoAvionics (Kongsberg Gruppen ASA)
- 7.4.11 Thales Alenia Space (Thales and Leonardo S.p.A)
- 7.4.12 Iridium Communications Inc.
- 7.4.13 Spire Global, Inc.
- 7.4.14 ICEYE
- 7.4.15 Chang Guang Satellite Technology Co., Ltd. (CGSTL)
- 7.4.16 Satellogic Inc.
8 MARKET OPPORTUNITIES AND FUTURE OUTLOOK
- 8.1 White-space and Unmet-need Assessment

