PUBLISHER: Mordor Intelligence | PRODUCT CODE: 2044245

PUBLISHER: Mordor Intelligence | PRODUCT CODE: 2044245
Niobium Pentoxide - Market Share Analysis, Industry Trends & Statistics, Growth Forecasts (2025 - 2031)
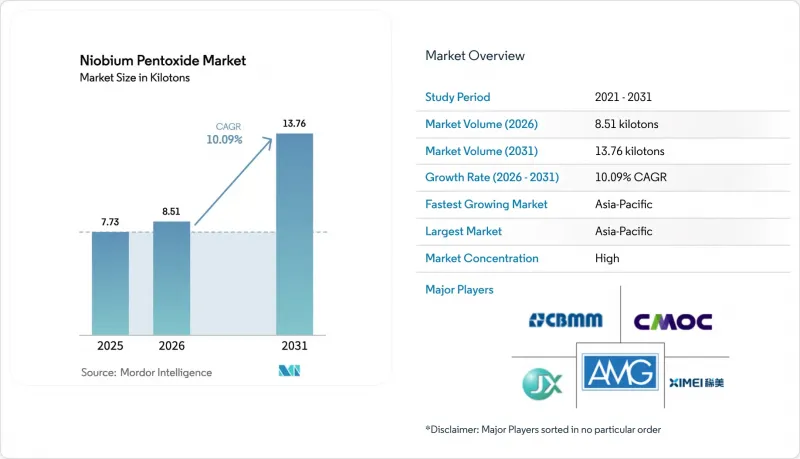
The Niobium Pentoxide Market size is projected to expand from 7.73 kilotons in 2025 and 8.51 kilotons in 2026 to 13.76 kilotons by 2031, registering a CAGR of 10.09% between 2026 to 2031.
Robust infrastructure spending in Asia, a steady aerospace-fleet renewal cycle in North America, and rapid adoption of ultra-fast-charging battery chemistries are sustaining double-digit demand growth. Bulk consumption in high-strength steels continues to anchor volumes, yet rapidly scaling niche uses in optical glass, additive-manufacturing powders, and 5G radio-frequency sputtering targets are improving the overall value mix. Supply-chain diversification initiatives outside Brazil have gathered pace since 2024, but CBMM's dominant ore reserve still underpins price discovery. Forward-looking procurement teams are therefore tying up long-term offtake contracts and investing in closed-loop recycling to hedge volatility.
Global Niobium Pentoxide Market Trends and Insights
Growing Demand for High-Refractive-Index Optical Glass
Japanese glassmakers ramped Nb2O5-doped blank output in 2024 to satisfy smartphone and augmented-reality lens programs, achieving refractive indices above 1.9 without lead additions. Aspherical camera elements now contain up to 20 weight percent niobium pentoxide, enabling thinner modules in premium handsets and lighter optics in head-mounted displays. Automakers are also specifying niobium-doped silica in solid-state lidar waveguides to reduce scattering losses. Optical uses consume less than 2% of global volume, yet their margin premium supports incremental capacity for 4N refining. Producers, therefore, balance allocations between high-value glass and bulk steel channels to maximize asset utilization.
Rising Adoption in High-Strength Steels and Superalloys
Pipeline builders rely on 0.02-0.05% niobium additions to hit API 5L X80 grade without post-weld heat treatment, a benefit that speeds Arctic and deepwater projects. China laid nearly 8,000 kilometers of transmission pipe annually between 2024 and 2025, keeping ferroniobium demand resilient even as rebar growth slowed. In aviation, niobium-bearing superalloys such as Inconel 718 deliver creep resistance above 650 °C, a prerequisite for geared turbofan disks certified in 2024. The dual pull from infrastructure and aerospace secures a long-run foundation for bulk oxide consumption.
Health and Safety Concerns from Nb2O5 Dust Exposure
OSHA caps respirable niobium-compound dust at 5 mg/m3, pushing refiners to install enclosed handling and real-time monitors. Europe's REACH regime demands downstream exposure assessments for volumes over one tonne, adding compliance engineering costs of 8-12% on new lines. Smaller North American converters have merged to amortize these expenses, leaving seven suppliers in 2025 versus eleven in 2020. Automation and inert-gas transfers relieve litigation risk, yet margin erosion of one to two points persists, tempering near-term investment appetites.
Other drivers and restraints analyzed in the detailed report include:
- Expansion of Nb2O5-Based Fast-Charging Batteries and Supercapacitors
- Emerging Use in 5G / AR Sputtering Targets
- Supply-Chain Concentration in Brazil
For complete list of drivers and restraints, kindly check the Table Of Contents.
Segment Analysis
The 3N grade captured 67.26% of global volume in 2025, underscoring its status as preferred feedstock for ferroniobium and master-alloy chains. This segment is forecast to post a 10.77% CAGR to 2031, keeping pace with overall niobium pentoxide market expansion. Industrial-grade oxide trails because pigment and glass uses tolerate wider impurity windows, allowing partial substitution by lower-cost zirconium or cerium compounds. Meanwhile, the 4N segment serves semiconductor sputtering targets and single-crystal growth, and is expanding quickly as radio-frequency filter demand rises. JX Advanced Metals lifted 4N capacity by 40% in 2024 to supply Korean fabs, a sign that ultra-pure streams can justify premium pricing when underpinned by multiyear volume commitments.
Long-standing quarterly ferroniobium benchmarks shield metallurgical-grade buyers from spot volatility, fostering predictable cash flow across the niobium pentoxide market. By contrast, 4N refiners must ride semiconductor capital-expenditure cycles that swing as much as 30% year over year. ISO 11135:2024 now defines an intermediate "medical-device" grade that caps tantalum and titanium below 500 ppm, effectively splitting the spectrum between bulk 3N and ultra-pure 4N. Converters that certify to both ISO 9001 and the new medical standard are poised to capture emerging sterilization and imaging niches.
The Niobium Pentoxide Market Report is Segmented by Grade (Industrial Grade, 3N, and 4N), Application (Niobium Metal, Optical Glass, Supercapacitors, Superalloys, Ceramics, and Others), and Geography (North America, South America, Europe, Asia-Pacific, and Middle East and Africa). The Market Forecasts are Provided in Terms of Volume (Tons).
Geography Analysis
Asia-Pacific accounted for 46.72% of the niobium pentoxide market volume in 2025 and is projected to grow at 12.59% through 2031, the fastest regional growth. China's 54% share of global crude-steel output anchors ferroniobium pull, while Japan and South Korea command ultra-pure niches tied to semiconductor and optics value chains. India's highway build-out and oil-and-gas pipeline expansions are boosting demand for niobium-microalloyed steels, supported by policy targets that aim for 25,000 kilometers of new highways by 2026. Vietnam and Indonesia are emerging as secondary hubs as they commission integrated mills specifying ferroniobium for high-rise construction.
North American and European consumption of niobium pentoxide is affected by mature steel demand. The United States restarted domestic oxide production in 2025 at Boyertown under a USD 26.4 million Title III award, insulating aerospace and defense flows from single-source risk. Europe tilts toward 4N purity for semiconductor equipment, yet carbon-pricing under the EU ETS inflates refining costs, prompting some converters to relocate ultra-pure steps to Asia. The EU Critical Raw Materials Act of 2024 streamlines permits for niobium projects, but price parity with Asian supply remains elusive.
South America, the Middle East, and Africa together are witnessing rising demand for niobium pentoxide. Globe Metals' Kanyika project in Malawi, finalized in 2024, targets first production by 2027 at 3,267 tpa, which could supply 4% of global demand and diversify the upstream base. Middle-East uptake centers on niobium-stabilized stainless steels for sour-gas pipelines, an example being Saudi Aramco's Jafurah field that broke ground in 2024. These niche regional drivers provide a modest but strategically important buffer against any Brazilian disruption.
- CBMM
- Edgetech Industries LLC,
- Admat Inc.,
- American Elements
- AMG
- Chengdu Huarui Industrial Co., Ltd.
- CMOC
- F&X Electro-Materials Limited
- Global Advanced Metals Pty Ltd
- Hebei Suoyi New Material Technology Co., Ltd.
- JX Advanced Metals Corporation
- Kurt J. Lesker Company
- Materion Corp.
- Mitsui Mining & Smelting Co., Ltd.
- MPIL
- SCI Engineered Materials
- Solikamsk Magnesium Plant
- Taki Chemical Co., Ltd.
- TANIOBIS
- XIMEI Resources Holding Limited
Additional Benefits:
- The market estimate (ME) sheet in Excel format
- 3 months of analyst support
TABLE OF CONTENTS
1 Introduction
- 1.1 Study Assumptions and Market Definition
- 1.2 Scope of the Study
2 Research Methodology
3 Executive Summary
4 Market Landscape
- 4.1 Market Overview
- 4.2 Market Drivers
- 4.2.1 Growing demand for high-refractive-index optical glass
- 4.2.2 Rising adoption in high-strength steels and superalloys
- 4.2.3 Expansion of Nb2O5-based fast-charging batteries and supercapacitors
- 4.2.4 Emerging use in 5G/AR sputtering targets
- 4.2.5 Lead-free high-k dielectric ceramics replacing PbO
- 4.3 Market Restraints
- 4.3.1 Health and safety concerns from Nb2O5 dust exposure
- 4.3.2 Supply-chain concentration in Brazil
- 4.3.3 High energy and carbon footprint of ultra-pure refining
- 4.4 Value Chain Analysis
- 4.5 Porter's Five Forces
- 4.5.1 Bargaining Power of Suppliers
- 4.5.2 Bargaining Power of Buyers
- 4.5.3 Threat of New Entrants
- 4.5.4 Threat of Substitutes
- 4.5.5 Degree of Competition
- 4.6 Supply Analysis
- 4.7 Regulatory Policy Analysis
- 4.8 Trade Analysis
- 4.9 Price Trend Analysis
- 4.10 Production Cost Analysis
5 Market Size and Growth Forecasts (Volume)
- 5.1 By Grade
- 5.1.1 Industrial Grade (99-99.8 %)
- 5.1.2 3N (99.9 %)
- 5.1.3 4N (99.99 %)
- 5.2 By Application
- 5.2.1 Niobium Metal
- 5.2.2 Optical Glass
- 5.2.3 Supercapacitors
- 5.2.4 Superalloys
- 5.2.5 Ceramics
- 5.2.6 Others
- 5.3 By Geography
- 5.3.1 Asia-Pacific
- 5.3.1.1 China
- 5.3.1.2 India
- 5.3.1.3 Japan
- 5.3.1.4 South Korea
- 5.3.1.5 ASEAN Countries
- 5.3.1.6 Rest of Asia-Pacific
- 5.3.2 North America
- 5.3.2.1 United States
- 5.3.2.2 Canada
- 5.3.2.3 Mexico
- 5.3.3 Europe
- 5.3.3.1 Germany
- 5.3.3.2 United Kingdom
- 5.3.3.3 France
- 5.3.3.4 Italy
- 5.3.3.5 Spain
- 5.3.3.6 Nordic Countries
- 5.3.3.7 Turkey
- 5.3.3.8 Russia
- 5.3.3.9 Rest of Europe
- 5.3.4 South America
- 5.3.4.1 Brazil
- 5.3.4.2 Argentina
- 5.3.4.3 Rest of South America
- 5.3.5 Middle-East and Africa
- 5.3.5.1 Saudi Arabia
- 5.3.5.2 South Africa
- 5.3.5.3 Rest of Middle-East and Africa
- 5.3.1 Asia-Pacific
6 Competitive Landscape
- 6.1 Market Concentration
- 6.2 Strategic Moves
- 6.3 Market Share/Ranking Analysis
- 6.4 Company Profiles {(includes Global level Overview, Market level overview, Core Segments, Financials as available, Strategic Information, Market Rank/Share for key companies, Products and Services, and Recent Developments)}
- 6.4.1 CBMM
- 6.4.2 Edgetech Industries LLC,
- 6.4.3 Admat Inc.,
- 6.4.4 American Elements
- 6.4.5 AMG
- 6.4.6 Chengdu Huarui Industrial Co., Ltd.
- 6.4.7 CMOC
- 6.4.8 F&X Electro-Materials Limited
- 6.4.9 Global Advanced Metals Pty Ltd
- 6.4.10 Hebei Suoyi New Material Technology Co., Ltd.
- 6.4.11 JX Advanced Metals Corporation
- 6.4.12 Kurt J. Lesker Company
- 6.4.13 Materion Corp.
- 6.4.14 Mitsui Mining & Smelting Co., Ltd.
- 6.4.15 MPIL
- 6.4.16 SCI Engineered Materials
- 6.4.17 Solikamsk Magnesium Plant
- 6.4.18 Taki Chemical Co., Ltd.
- 6.4.19 TANIOBIS
- 6.4.20 XIMEI Resources Holding Limited
7 Market Opportunities and Future Outlook
- 7.1 White-space and Unmet-Need Assessment

