PUBLISHER: Mordor Intelligence | PRODUCT CODE: 2044248

PUBLISHER: Mordor Intelligence | PRODUCT CODE: 2044248
Japan POS Terminals - Market Share Analysis, Industry Trends & Statistics, Growth Forecasts (2026 - 2031)
The Japan POS Terminals Market size was valued at USD 7.16 billion in 2025 and is estimated to grow from USD 7.61 billion in 2026 to reach USD 8.82 billion by 2031, at a CAGR of 3% during the forecast period (2026-2031).
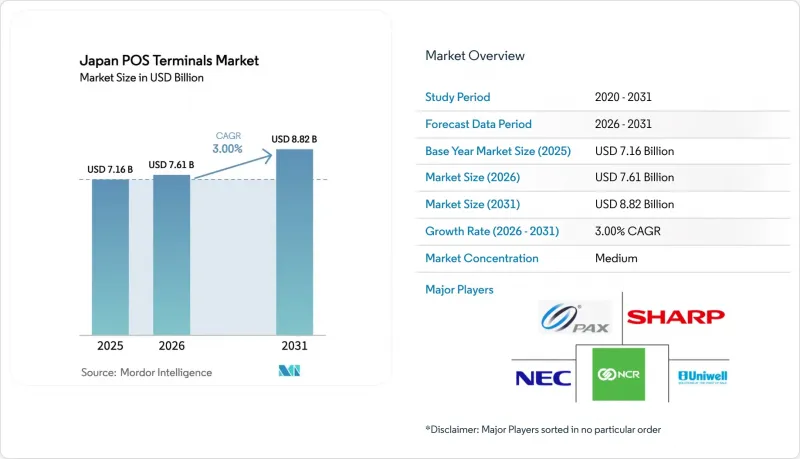
Heightened government backing for a 40% cashless ratio, rising contactless preference in travel and quick-service retail, and vendor commitments to AI-driven edge analytics combine to keep the growth curve intact. Rapid My-Number card integration widens the user base and deepens functional requirements, prompting merchants to favor terminals that merge identity verification with payment acceptance. Semiconductor supply stabilization since late-2024 shortens delivery lead times, allowing retailers to accelerate upgrade projects that had stalled during the prolonged chip crunch.Advancing 5G coverage further boosts mobile POS performance, enabling cloud synchronization and real-time analytics even in previously underserved areas. These intertwined factors cement the upward trajectory of the Japan POS terminals market while offering differentiated entry points for both hardware and software specialists.
Japan POS Terminals Market Trends and Insights
Boom in Mobile POS Adoption Across SMEs
Mobile POS installations climbed from 99,000 stores in 2015 to 350,000 stores by 2020 and have kept climbing as small and midsize merchants hunt for cost-efficient digital tools. Sumitomo Mitsui Card's "next stera" roadmap seeks 1 million deployments by 2030, highlighting the scale of latent demand. Japan's first MPoC-certified SoftPOS, launched through a Soft Space and GMO Financial Gate alliance, turns standard smartphones into secure payment devices. Merchant appetite is lifted by lower hardware outlays, shorter rollout times, and value-added analytics that fixed terminals struggle to match. Regulatory pressure nudges the same direction because PCI DSS v4.0 encourages cloud orchestration over on-premise software. Together, economics and compliance converge to keep mobile POS at the core of the Japan POS terminals market expansion.
Surge in My-Number Linked Cashless Incentive Programs
The Cabinet Office aims for a 40% cashless ratio by 2025 and channels subsidies toward terminals capable of authenticating My-Number cards. Hospitals receive dedicated support to replace legacy machines so that insurance data, identity checks, and payment flows merge on one screen. Convenience chains mirror the push, retrofitting thousands of lanes to accept card-based identity verification at checkout. Local governments run QR campaigns tailored for seniors, reducing perceived complexity and stimulating terminal upgrades in community pharmacies and local grocers. Functionality now extends to automated tax reporting and loyalty aggregation, placing fresh performance demands on processors, memory, and encryption modules within each device. As a result, the Japan POS terminals market sees a durable boost anchored not in standard consumer spending cycles but in publicly funded modernization.
Persistent Preference for Cash Among Senior Citizens
Japan recorded a 39.3% national cashless ratio in 2023, yet age-based divergence remains sharp as seniors cling to physical money. Surveys show QR uptake running 35% among the 18-29 cohort but lagging by double digits for those above 60. Rural merchants therefore hesitate to invest in advanced terminals when usage could stay low for years. Local authorities test coupon-backed QR campaigns to coax older shoppers, but success varies by prefecture. Vendors compensate by adding tactile keys and large-font screens, driving bill-of-materials costs upward and trimming gross margins. Consequently, while overall growth stays intact, the Japan POS terminals market must negotiate an entrenched cash culture that bleeds momentum outside metropolitan zones.
Other drivers and restraints analyzed in the detailed report include:
- Growing QR-Code Interoperability (JPQR) Framework
- Upgrade Cycle Driven by PCI PTS v6.0 Compliance Deadline
- Intensifying Domestic Data-Localization Regulations
For complete list of drivers and restraints, kindly check the Table Of Contents.
Segment Analysis
Contactless acceptance held a 62.38% share of the Japan POS terminals market in 2025 and is now compounding at a 4.70% CAGR, permeating vending, transit, and quick-serve venues. Initiatives such as the rollout of contactless readers across 20,000 ME-20 vending machines each year display how firmware upgrades can modernize sprawling installed bases without wholesale replacement. Once early hardware investment is amortized, merchants note throughput gains that translate into higher transaction volumes per store. Consumers report a preference for tap-and-go below USD 40, accelerating habit formation. As EMV tokenization matures, contactless also extends into mid-ticket categories, eating into contact dominance.
On the horizon, QR and contactless may converge as terminals juggle NFC and camera inputs on the same board. Vendors integrate dual readers plus software routing that picks the optimal rail depending on card scheme or wallet used. This multi-modal design lets chains hedge against evolving consumer tastes while controlling capital outlays. Because upgrade projects now aim for 7-year lifecycles, forward-compatible firmware proves a decisive purchasing factor. Such design choices will recalibrate the balance between contact and contactless through 2031, supporting steady re-ordering inside the Japan POS terminals market.
The Japan POS Terminals Market Report is Segmented by Mode of Payment Acceptance (Contact-Based, and Contactless), POS Type (Fixed Point-Of-Sale Systems, and Mobile/Portable Point-Of-Sale Systems), End-User Industry (Retail, Hospitality, Healthcare, Transportation and Logistics, and Other End-User Industries). The Market Forecasts are Provided in Terms of Value (USD).
List of Companies Covered in this Report:
- NEC Corporation
- NCR Corporation
- PAX Global Technology Limited
- Sharp Corporation
- Uniwell Corporation
- Fujitsu Limited
- Casio Computer Co., Ltd.
- Samsung Electronics Co., Ltd.
- Ingenico SA
- Vesca Co., Ltd.
- Oracle Corporation
- Toshiba TEC Corporation
- Seiko Epson Corporation
- Panasonic Connect Co., Ltd.
- Hitachi-Omron Terminal Solutions, Corp.
- BBPOS International Limited
- SZZT Electronics Co., Ltd.
- SUNMI Technology Co., Ltd.
- Newland Digital Technology Co., Ltd.
- Clover Network, Inc. (Fiserv subsidiary)
Additional Benefits:
- The market estimate (ME) sheet in Excel format
- 3 months of analyst support
TABLE OF CONTENTS
1 INTRODUCTION
- 1.1 Study Assumptions and Market Definition
- 1.2 Scope of the Study
2 RESEARCH METHODOLOGY
3 EXECUTIVE SUMMARY
4 MARKET LANDSCAPE
- 4.1 Market Overview
- 4.2 Market Drivers
- 4.2.1 Boom in mobile POS (m-POS) adoption across SMEs
- 4.2.2 Surge in "My-Number" linked cashless incentive programs
- 4.2.3 Growing QR-code interoperability (JPQR) framework
- 4.2.4 Upgrade cycle driven by PCI PTS v6.0 compliance deadline
- 4.2.5 Integration of POS with tax-free shopping platforms for inbound tourism
- 4.2.6 AI-driven loss-prevention analytics embedded into POS terminals
- 4.3 Market Restraints
- 4.3.1 Intensifying domestic data-localization regulations
- 4.3.2 Persistent preference for cash among senior citizens
- 4.3.3 Semiconductor supply-chain volatility post-2025
- 4.3.4 Rising total cost of ownership for omni-channel POS
- 4.4 Impact of Macroeconomic Factors
- 4.5 Industry Value Chain Analysis
- 4.6 Regulatory Landscape (Key Regulations and Compliance Standards)
- 4.7 Technological Outlook
- 4.8 Porter's Five Forces Analysis
- 4.8.1 Bargaining Power of Suppliers
- 4.8.2 Bargaining Power of Buyers
- 4.8.3 Threat of New Entrants
- 4.8.4 Threat of Substitutes
- 4.8.5 Intensity of Competitive Rivalry
- 4.9 Investment Analysis
- 4.10 Contactless Payment Adoption Analysis
- 4.11 Major Case Studies
5 MARKET SIZE AND GROWTH FORECASTS (VALUE)
- 5.1 By Mode of Payment Acceptance
- 5.1.1 Contact-based
- 5.1.2 Contactless
- 5.2 By POS Type
- 5.2.1 Fixed Point-of-Sale Systems
- 5.2.2 Mobile / Portable Point-of-Sale Systems
- 5.3 By End-User Industry
- 5.3.1 Retail
- 5.3.2 Hospitality
- 5.3.3 Healthcare
- 5.3.4 Transportation and Logistics
- 5.3.5 Other End-user Industries
6 COMPETITIVE LANDSCAPE
- 6.1 Market Concentration
- 6.2 Strategic Moves
- 6.3 Market Share Analysis
- 6.4 Company Profiles (includes Global level Overview, Market level overview, Core Segments, Financials as available, Strategic Information, Market Rank/Share for key companies, Products and Services, and Recent Developments)
- 6.4.1 NEC Corporation
- 6.4.2 NCR Corporation
- 6.4.3 PAX Global Technology Limited
- 6.4.4 Sharp Corporation
- 6.4.5 Uniwell Corporation
- 6.4.6 Fujitsu Limited
- 6.4.7 Casio Computer Co., Ltd.
- 6.4.8 Samsung Electronics Co., Ltd.
- 6.4.9 Ingenico SA
- 6.4.10 Vesca Co., Ltd.
- 6.4.11 Oracle Corporation
- 6.4.12 Toshiba TEC Corporation
- 6.4.13 Seiko Epson Corporation
- 6.4.14 Panasonic Connect Co., Ltd.
- 6.4.15 Hitachi-Omron Terminal Solutions, Corp.
- 6.4.16 BBPOS International Limited
- 6.4.17 SZZT Electronics Co., Ltd.
- 6.4.18 SUNMI Technology Co., Ltd.
- 6.4.19 Newland Digital Technology Co., Ltd.
- 6.4.20 Clover Network, Inc. (Fiserv subsidiary)
7 MARKET OPPORTUNITIES AND FUTURE OUTLOOK
- 7.1 White-space and Unmet-Need Assessment

