
PUBLISHER: Mordor Intelligence | PRODUCT CODE: 2044282

PUBLISHER: Mordor Intelligence | PRODUCT CODE: 2044282
Embedded Insurance - Market Share Analysis, Industry Trends & Statistics, Growth Forecasts (2026 - 2031)
The Embedded Insurance Market size is expected to increase from USD 13.88 billion in 2025 to USD 18.09 billion in 2026 and reach USD 68.12 billion by 2031, growing at a CAGR of 30.37% over 2026-2031.
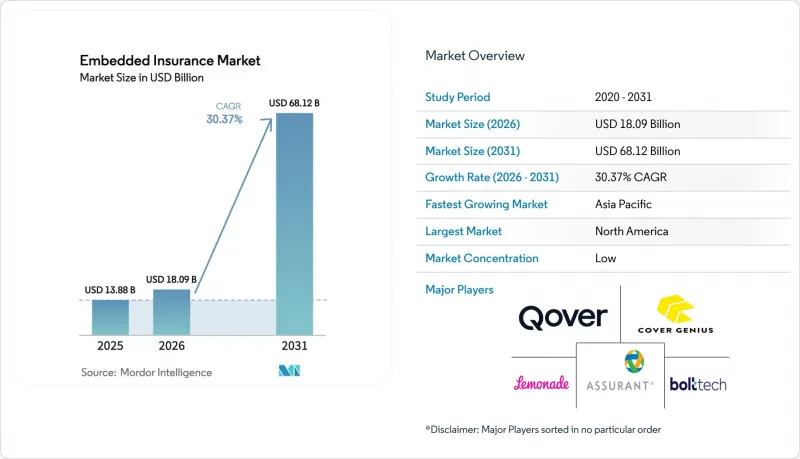
Momentum accelerates because API-first architectures shorten product-launch cycles, real-time data improves underwriting accuracy, and regulators encourage innovative channels that shrink protection gaps. Electronics protection remains the largest embedded insurance line, supported by checkout add-ons on global e-commerce sites, while usage-based micro-auto policies underpinned by connected-car data post the fastest growth. Online and API-first distribution leads with more than 76.38% revenue share, and marketplaces dominate end-user industries. Regionally, North America still commands the highest share, but Asia-Pacific is expanding the quickest as greenfield digital ecosystems take shape. Competitive intensity is moderate; incumbent carriers such as Chubb and Allianz Partners fight for partnership slots against API-centric insurtechs like Cover Genius and Bolttech, with regulatory know-how and integration agility emerging as key success factors.
Global Embedded Insurance Market Trends and Insights
Seamless Digital Checkout Demand Surge
Embedded offers are becoming standard inside digital checkouts, which conditions buyers to accept protection when it is contextually paired with a transaction. Conversion performance improves when the offer is placed at the moment of need with pre-filled data, while pricing remains close to off-site equivalents and reduces cognitive load for the buyer. Retailers and marketplaces reinforce this pattern by treating protection as a core part of the product experience rather than an afterthought. Regulatory expectations around fair value and clear outcomes also help normalize embedded models by emphasizing transparency for add-on insurance. These changes reinforce how the embedded insurance market integrates into purchase flows where speed and simplicity drive adoption at scale.
Embedded Distribution Lowers CAC for Insurers
Customer acquisition costs fall when insurers embed directly into a host platform that already has verified users and transaction data. Dealers that present bindable quotes during vehicle purchase are seeing measurable financial gains, with one study showing a 20% lift in finance and insurance gross profit and a per-deal uplift when policies are bound in session. These results come from aligning the offer with the buyer's timing and using platform data to streamline underwriting and payment steps. Renewal rates can improve as well when policies auto-renew through the platform's billing rails. Together, these effects help the embedded insurance market accelerate policy conversion while reducing the reliance on high-cost advertising or agent commissions.
Fractured, Multi-Jurisdiction Compliance Burden
Complex licensing regimes and non-uniform approvals stretch launch timelines and raise costs for cross-border rollouts. In Europe, firm-level supervision and country-specific rules often require partner-by-partner product approvals, even when coverage terms are standard. In parts of the Middle East and Africa, evolving frameworks require additional steps for digital distribution and embedded intermediaries. These layers slow the pace at which platforms can unify their offerings across markets and reduce the immediate scalability of new products. This fragmentation acts as a drag on the embedded insurance market because orchestration benefits are diluted by regulatory friction in multi-country launches.
Other drivers and restraints analyzed in the detailed report include:
- Regulatory Push for Closing Protection Gap
- API First Partnerships with BigTech and Fintechs
- Data Privacy and Consent Management Hurdles
For complete list of drivers and restraints, kindly check the Table Of Contents.
Segment Analysis
Electronics protection captured 44.74% of the embedded insurance market share in 2025, reflecting stable demand at checkout for devices, appliances, and related add-ons across high-traffic retail and marketplace environments. Attach rates benefit from placement directly in the purchase flow and from simpler cover descriptions aligned to the item in the cart. Suppliers continue to invest in quality management and testing infrastructure to support certified pre-owned and refurbished channels, where warranties and protection plans are expected. Strategic expansions in automated device testing and diagnostics point to tighter links between hardware lifecycle management and embedded protection. These patterns anchor the largest revenue pool while setting up new forms of protection for longer product lifecycles and resale channels.
Micro auto cover is the fastest-growing line, powered by telematics and OEM-embedded journeys that integrate insurance into financing, ownership, and subscription workflows. These designs use connected vehicle data and platform billing rails to deliver policies that recalibrate in near real time, aligning price with usage and driving behavior. Automotive partners are also investing in claims and repair management capabilities to improve experience and speed, often coordinating with embedded assistance networks. Mobility-oriented expansions within large carriers support this shift by unifying product development, automation, and partner onboarding. These steps reinforce how auto linked coverage can scale within the embedded insurance market where vehicle data and financing journeys are already digitized.
Online and API led distribution accounted for a 76.38% share of the embedded insurance market size in 2025, and it is advancing at a 23.35% CAGR to 2031 based on standardized integrations that reduce launch times and increase partner breadth. Single API orchestration platforms connect multiple carriers and geographies, enabling a partner to activate coverage in days or weeks with unified servicing. This approach benefits enterprises that need country-level compliance handled behind the scenes and a consistent customer experience across markets. Core system vendors also support API first deployments with low-code accelerators that reduce the time to integrate quoting, binding, and policy issuance. These capabilities underpin the leading role of digital channels in the embedded insurance market and expand the range of partners who can add protection natively.
Offline distribution retains relevance where trust-based conversations, high-value assets, and multi-party decisions are common. Auto dealerships illustrate how in-person advice and embedded quoting can work together when F&I software surfaces competitive rates at the right moment. Over time, these programs are digitizing workflows with kiosks and mobile portals while maintaining human support during complex decisions. Licensing and producer rules still apply to offline locations and determine who can present, discuss, and bind coverage at the point of sale. These guardrails keep offline channels meaningful for specific categories while online APIs remain the engine of scale for the embedded insurance market.
The Embedded Insurance Market Report is Segmented by Insurance Line (Electronics Protection, Travel & Ticketing, and More), Distribution Channel (Online and Offline), End-User Industry (E-Commerce and Marketplaces, Travel and Hospitality, and More), Partner-Platform Type (Fintech, Telecom, and More), and Geography (North America, South America, and More). The Market Forecasts are Provided in Terms of Value (USD).
Geography Analysis
North America held 36.74% of the embedded insurance market share in 2025, supported by API first infrastructure, scale digital distribution, and active partner ecosystems across commerce, mobility, and finance. United States dealerships illustrate how embedded quoting at the point of sale can lift finance and insurance metrics when customers finalize coverage during the vehicle transaction. Ecosystem partners continue to integrate at speed through standardized interfaces, which helps scale new product variants in months instead of years. In Canada, fintech partnerships are embedding subscription-based protection for growing customer bases inside digital banking ecosystems. These dynamics keep North America a core revenue base for the embedded insurance market, with room for growth as more platforms adopt orchestration layers.
Asia Pacific is the fastest-growing region at a 19.37% CAGR as super apps and mobile-first platforms embed micro policies into ride-hailing, payments, and commerce flows. Cross-border orchestration improves the speed of rollout by centralizing issuance and claims across multiple markets within a single integration. In India, sandbox frameworks and digital public infrastructure encourage embedded use cases that pair protection with everyday transactions. Southeast Asian platforms use trip and delivery telemetry to trigger bite-sized accident and delay covers that pay out quickly. These features make Asia Pacific a central growth engine for the embedded insurance market as mobile ecosystems scale.
Europe advances steadily on the back of neobanking, mobility, and retail platforms, though regulatory fragmentation requires country-specific plans and partner-level approvals in several markets. Supervisory priorities emphasize consumer value, data protection, and appropriate use of automation, which shape product design and disclosures. Partnerships between carriers and orchestration platforms are expanding to serve multi-line and multi-country programs through unified stacks. Latin America and the Middle East and Africa regions are ramping digital distribution as financial inclusion initiatives and new partnerships extend reach into underserved segments. These factors collectively broaden the global footprint of the embedded insurance market while regional compliance and localization shape the rollout pace.
- Cover Genius
- Bolttech
- Qover
- Assurant
- Lemonade
- Companjon
- Igloo
- Extend
- Pattern Insurance
- Next Insurance
- Acko
- Root
- Allianz Partners
- Allstate Protection Plans
- Mulberri
- Fletch
- Bubble
- Rein
- Bsurance
- Penn-Io
- FetchaQuote
Additional Benefits:
- The market estimate (ME) sheet in Excel format
- 3 months of analyst support
TABLE OF CONTENTS
1 Introduction
- 1.1 Study Assumptions & Market Definition
- 1.2 Scope of the Study
2 Research Methodology
3 Executive Summary
4 Market Landscape
- 4.1 Market Overview
- 4.2 Market Drivers
- 4.2.1 Seamless digital-checkout demand surge
- 4.2.2 Embedded distribution lowers CAC for insurers
- 4.2.3 Regulatory push for closing protection gap
- 4.2.4 API-first partnerships with BigTech & fintechs
- 4.2.5 Vertical SaaS platforms targeting SMB cover
- 4.2.6 Real-time IoT data enables micro-policies
- 4.3 Market Restraints
- 4.3.1 Fractured, multi-jurisdiction compliance burden
- 4.3.2 Data-privacy & consent management hurdles
- 4.3.3 Channel conflict with agents & aggregators
- 4.3.4 Sparse actuarial history for granular cover
- 4.4 Regulatory Landscape
- 4.5 Technological Outlook (APIs, AI, IoT)
- 4.6 Porter's Five Forces
- 4.6.1 Threat of New Entrants
- 4.6.2 Bargaining Power of Buyers/Consumers
- 4.6.3 Bargaining Power of Suppliers
- 4.6.4 Threat of Substitutes
- 4.6.5 Intensity of Competitive Rivalry
- 4.7 Value Chain Analysis
- 4.8 Use-Case Deep-Dive (Insurer-Platform Partnerships)
5 Market Size & Growth Forecasts
- 5.1 By Insurance Line
- 5.1.1 Electronics Protection
- 5.1.2 Furniture & Home Appliances
- 5.1.3 Sports & Leisure Equipment
- 5.1.4 Travel & Ticketing
- 5.1.5 Auto & Mobility
- 5.1.6 Pet & Tuition
- 5.1.7 Other Niche Lines
- 5.2 By Distribution Channel
- 5.2.1 Online (API / SDK)
- 5.2.2 Offline (POS, Dealerships, Retail)
- 5.3 By End-user Industry
- 5.3.1 E-commerce & Marketplaces
- 5.3.2 Mobility & Automotive OEMs
- 5.3.3 Travel & Hospitality
- 5.3.4 Consumer Electronics Retail
- 5.3.5 Financial Services & Lending
- 5.3.6 SaaS / Vertical Platforms
- 5.4 By Partner-Platform Type
- 5.4.1 Marketplaces
- 5.4.2 Vertical SaaS
- 5.4.3 Fintech / Neobank
- 5.4.4 Telecom / Utilities Portals
- 5.5 By Geography
- 5.5.1 North America
- 5.5.1.1 United States
- 5.5.1.2 Canada
- 5.5.1.3 Mexico
- 5.5.2 South America
- 5.5.2.1 Brazil
- 5.5.2.2 Argentina
- 5.5.2.3 Rest of South America
- 5.5.3 Europe
- 5.5.3.1 United Kingdom
- 5.5.3.2 Germany
- 5.5.3.3 France
- 5.5.3.4 Italy
- 5.5.3.5 Spain
- 5.5.3.6 Rest of Europe
- 5.5.4 Asia-Pacific
- 5.5.4.1 China
- 5.5.4.2 India
- 5.5.4.3 Japan
- 5.5.4.4 Australia
- 5.5.4.5 Rest of Asia-Pacific
- 5.5.5 Middle East & Africa
- 5.5.5.1 United Arab Emirates
- 5.5.5.2 Saudi Arabia
- 5.5.5.3 South Africa
- 5.5.5.4 Rest of Middle East & Africa
- 5.5.1 North America
6 Competitive Landscape
- 6.1 Market Concentration
- 6.2 Strategic Moves
- 6.3 Market Share Analysis
- 6.4 Company Profiles (includes Global level Overview, Market level overview, Core Segments, Financials as available, Strategic Information, Market Rank/Share for key companies, Products & Services, and Recent Developments)
- 6.4.1 Cover Genius
- 6.4.2 Bolttech
- 6.4.3 Qover
- 6.4.4 Assurant
- 6.4.5 Lemonade
- 6.4.6 Companjon
- 6.4.7 Igloo
- 6.4.8 Extend
- 6.4.9 Pattern Insurance
- 6.4.10 Next Insurance
- 6.4.11 Acko
- 6.4.12 Root
- 6.4.13 Allianz Partners
- 6.4.14 Allstate Protection Plans
- 6.4.15 Mulberri
- 6.4.16 Fletch
- 6.4.17 Bubble
- 6.4.18 Rein
- 6.4.19 Bsurance
- 6.4.20 Penn-Io
- 6.4.21 FetchaQuote
7 Market Opportunities & Future Outlook
- 7.1 Product Innovation with Personalized & On-Demand Coverage
- 7.2 Cross-Industry Partnerships & Ecosystem Integrations

