PUBLISHER: Mordor Intelligence | PRODUCT CODE: 2044291

PUBLISHER: Mordor Intelligence | PRODUCT CODE: 2044291
United States Real Estate Brokerage - Market Share Analysis, Industry Trends & Statistics, Growth Forecasts (2025 - 2031)
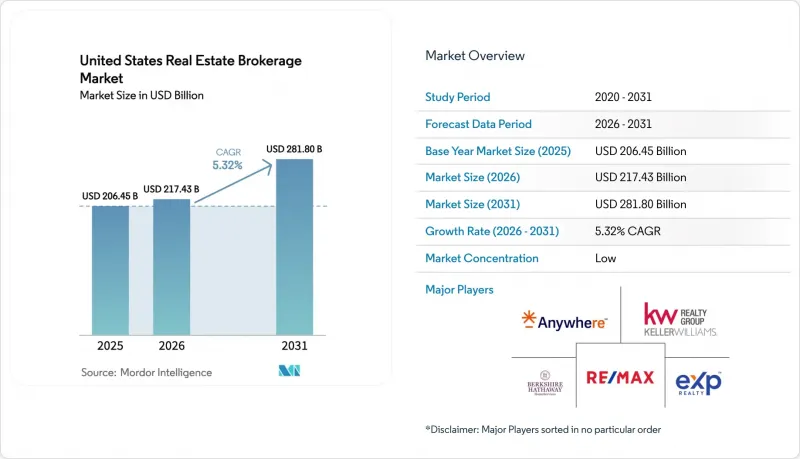
The United States Real Estate Brokerage Market size was valued at USD 206.45 billion in 2025 and is estimated to grow from USD 217.43 billion in 2026 to reach USD 281.80 billion by 2031, at a CAGR of 5.32% during the forecast period (2026-2031).
Mortgage rates hovering near 6.8% in early 2026 are suppressing purchasing power, yet elevated household formation and steady in-migration keep transaction pipelines active. Regulatory shifts following the November 2024 National Association of Realtors (NAR) settlement compel brokerages to decouple buyer-agent fees from Multiple Listing Service (MLS) displays, accelerating experimentation with flat-fee and rebate models. At the same time, the Department of Justice (DOJ) continues antitrust scrutiny, which nudges the industry toward transparent, value-based pricing. Cloud-enabled brokerages and artificial-intelligence (AI) valuation tools are compressing listing-to-closing cycles, helping firms offset commission pressure through higher volume and ancillary service bundling.
United States Real Estate Brokerage Market Trends and Insights
Rising Housing Demand and Household Formation Increase Residential Property Transaction Volumes
Millennials entering peak home-buying years and immigration-driven population growth produced 1.4 million new U.S. households in 2024, the highest reading since 2020. Robust household formation underpins the residential segment's 82.40% revenue share, yet high prices push many first-time buyers toward rentals, which lengthens leasing cycles. Median household net worth climbed 23% between 2019 and 2025, consolidating wealth among owners and intensifying renter aspirations. New construction starts hit an annualized 1.56 million units in Q4 2025, signaling future inventory relief that should stabilize pricing and sustain volumes for the United States real estate brokerage market. Brokerages bundling mortgage pre-approvals, title services, and moving packages are capturing more fee income per deal, cushioning against commission compression.
Recovery in Housing Inventory and New-Build Pipelines Supports Higher Brokerage Activity
Active listings rose 14% year over year (YoY) to 1.08 million in December 2025, marking the healthiest year-end supply since 2019. Builder sentiment, tracked by the National Association of Home Builders, improved to an index level of 47 in December 2025 from 31 two years earlier, encouraging developers to accelerate spec-home activity. Single-family building permits exceeded 1.02 million in 2025, with Texas, Florida, and North Carolina accounting for the largest shares. An influx of listings boosts transaction counts for both buy- and sell-side agents in the United States real estate brokerage market, although competitive pressure can compress seller commission percentages when supply overshoots demand. Brokerages leveraging virtual tours and AI-driven pricing differentiate by moving inventory faster in high-listing environments.
Mortgage-Rate Volatility Reduces Buyer Affordability and Slows Property Transactions
The average 30-year fixed mortgage rate settled at 6.82% in January 2026, well below the October 2023 high of 7.79% yet double the pandemic-era lows. Elevated financing costs are reducing purchasing power, as a household budgeting USD 3,000 per month can now afford a USD 350,000 home compared with USD 450,000 at a 3.5% mortgage rate, shrinking the eligible buyer pool by 22%. The Federal Reserve signaled potential rate cuts later in 2026, but sticky inflation may keep rates above 6.0% into mid-2027. First-time buyers, only 26% of purchasers in 2025 compared with a historical 40%, feel the pinch most acutely. Transaction volumes in the United States real estate brokerage market, therefore, skew toward cash or high-equity buyers, eroding volume-driven revenue models.
Other drivers and restraints analyzed in the detailed report include:
- Growing Adoption of Digital Lead-Generation Platforms and CRM Systems Improves Brokerage Efficiency
- Expansion of Cloud-Based and Low-Overhead Brokerage Models Attracts New Agents and Firms
- NAR Settlement Changes Trigger Buyer-Pays Structures and Intensify Commission Discount Competition
For complete list of drivers and restraints, kindly check the Table Of Contents.
Segment Analysis
Residential brokerage delivered 82.40% of 2025 revenue for the United States real estate brokerage market share, buoyed by single-family, condominium, and apartment transactions. Logistics-driven industrial spaces, data centers, and mixed-use retail assets underpin commercial's faster 4.77% CAGR forecast to 2031, outstripping the mature residential trajectory. Office leasing stabilized in late 2025, but the national vacancy near 18.2% restrains commission upside. Conversely, warehouse absorption of 400 million ft2 in 2024 testified to e-commerce and near-shoring tailwinds. Brokerages specializing in industrial placements command higher per-deal fees and often secure retainer-based mandates from third-party logistics providers.
Residential sales retain momentum through elevated household formation, yet affordability gaps encourage many customers to transition into build-to-rent communities, expanding leasing commissions. The United States real estate brokerage market size for residential leasing is expected to broaden as institutional investors deepen single-family rental portfolios, providing steady engagements for brokerages with property-management arms. Commercial specialists differentiate via capital-markets advisory, tenant-rep services, and sale-leaseback structuring. Meanwhile, mixed-use projects blending residential, retail, and flexible office spaces foster cross-selling opportunities that enlarge brokerage wallet share. As sustainability mandates broaden, energy-efficient retrofits and green-lease clauses introduce advisory niches that further diversify fee pools.
United States Real Estate Brokerage Market Report is Segmented by Property Type (Residential and Commercial), by Service (Sales and Rental), by Client Type (Individuals/Households, Corporates & SMEs, Others), and by State (Texas, California, Florida, and More). The Market Forecasts are Provided in Terms of Value (USD).
List of Companies Covered in this Report:
- Anywhere Real Estate
- Keller Williams Realty
- RE/MAX
- Berkshire Hathaway HomeServices
- eXp Realty
- Compass
- Redfin
- Sotheby's International Realty
- Howard Hanna Real Estate Services
- Realty ONE Group
- Douglas Elliman
- HomeSmart
- Weichert Realtors
- Better Homes & Gardens Real Estate
- Corcoran Group
- JPAR ? Real Estate
- United Real Estate
- EXIT Realty
- ERA Real Estate
- Opendoor Brokerage
Additional Benefits:
- The market estimate (ME) sheet in Excel format
- 3 months of analyst support
TABLE OF CONTENTS
1 Introduction
- 1.1 Study Assumptions and Market Definition
- 1.2 Scope of the Study
2 Research Methodology
3 Executive Summary
4 Market Insights and Dynamics
- 4.1 Market Overview
- 4.2 Market Drivers
- 4.2.1 Rising housing demand and household formation increase residential property transaction volumes
- 4.2.2 Growing adoption of digital lead-generation platforms and CRM systems improves brokerage efficiency
- 4.2.3 Recovery in housing inventory and new-build pipelines supports higher brokerage activity
- 4.2.4 Expansion of cloud-based and low-overhead brokerage models attracts new agents and firms
- 4.2.5 AI-driven property valuation tools shorten the listing-to-closing transaction cycle
- 4.2.6 Tokenized real estate deals create new brokerage revenue streams and fee pools
- 4.3 Market Restraints
- 4.3.1 Mortgage-rate volatility reduces buyer affordability and slows property transactions
- 4.3.2 Department of Justice scrutiny of buyer-agent commissions pressures traditional brokerage models
- 4.3.3 NAR settlement changes trigger buyer-pays structures and intensify commission discount competition
- 4.3.4 Commission-free iBuyer platforms bypass traditional brokers and reduce brokerage participation
- 4.4 Value/Supply-Chain Analysis
- 4.5 Regulatory Landscape
- 4.6 Technological Outlook
- 4.7 Porter's Five Forces
- 4.7.1 Bargaining Power of Suppliers
- 4.7.2 Bargaining Power of Consumers
- 4.7.3 Threat of New Entrants
- 4.7.4 Threat of Substitutes
- 4.7.5 Intensity of Competitive Rivalry
5 Market Size and Growth Forecasts (Value in USD)
- 5.1 By Property Type
- 5.1.1 Residential
- 5.1.1.1 Apartments and Condominums
- 5.1.1.2 Villas and Landed Houses
- 5.1.2 Commercial
- 5.1.2.1 Office
- 5.1.2.2 Retail
- 5.1.2.3 Logistics
- 5.1.2.4 Others
- 5.1.1 Residential
- 5.2 By Service
- 5.2.1 Sales
- 5.2.2 Rental/Leasing
- 5.3 By Client Type
- 5.3.1 Individuals/Households
- 5.3.2 Corporates & SMEs
- 5.3.3 Others
- 5.4 By State
- 5.4.1 Texas
- 5.4.2 California
- 5.4.3 Florida
- 5.4.4 New York
- 5.4.5 Illinois
- 5.4.6 Rest of the United States
6 Competitive Landscape
- 6.1 Market Concentration
- 6.2 Strategic Moves
- 6.3 Company Profiles (includes Global level Overview, Market level overview, Core Segments, Financials as available, Strategic Information, Products & Services, and Recent Developments)
- 6.3.1 Anywhere Real Estate
- 6.3.2 Keller Williams Realty
- 6.3.3 RE/MAX
- 6.3.4 Berkshire Hathaway HomeServices
- 6.3.5 eXp Realty
- 6.3.6 Compass
- 6.3.7 Redfin
- 6.3.8 Sotheby's International Realty
- 6.3.9 Howard Hanna Real Estate Services
- 6.3.10 Realty ONE Group
- 6.3.11 Douglas Elliman
- 6.3.12 HomeSmart
- 6.3.13 Weichert Realtors
- 6.3.14 Better Homes & Gardens Real Estate
- 6.3.15 Corcoran Group
- 6.3.16 JPAR ? Real Estate
- 6.3.17 United Real Estate
- 6.3.18 EXIT Realty
- 6.3.19 ERA Real Estate
- 6.3.20 Opendoor Brokerage
7 Market Opportunities & Future Outlook
- 7.1 White-space & Unmet-Need Assessment

