
PUBLISHER: Mordor Intelligence | PRODUCT CODE: 2061509

PUBLISHER: Mordor Intelligence | PRODUCT CODE: 2061509
Biosimilars - Market Share Analysis, Industry Trends & Statistics, Growth Forecasts (2026 - 2031)
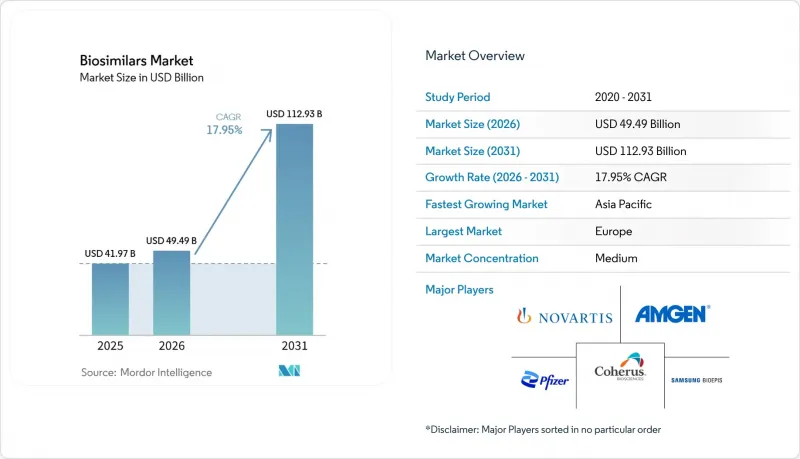
According to Mordor Intelligence, the biosimilars market size is expected to increase from USD 41.97 billion in 2025 to USD 49.49 billion in 2026 and reach USD 112.93 billion by 2031, growing at a CAGR of 17.95% over 2026-2031.
This report Segments the Industry Into by Product Class (Monoclonal Antibodies, Recombinant Hormones, and More), Indication (Blood Disorders, Autoimmune & Chronic Inflammatory, and More), End User (Hospitals, and More), Manufacturing Type (In-House, and More), Route of Administration (Intravenous, and Sub-Cutaneous), and Geography (North America, Europe, Asia-Pacific, Middle East, and South America).
Global Biosimilars Market Trends and Insights
Imminent Patent Expiry of Multiple Blockbuster Biologics
Market size expansion is being propelled by an unprecedented wave of patent expirations that will unlock an estimated USD 400 billion in reference product sales between 2029 and 2034. Because 25 high-value biologics lose exclusivity in 2025 alone, developers are rushing to secure development slots and manufacturing slots simultaneously. The inference drawn here is that development pipelines are now so crowded that analytical testing capacity, not funding, is emerging as the gating factor for some programs. Companies such as Sandoz have already disclosed pipelines of 28 molecules, demonstrating the scale of the opportunity . Oncology-focused monoclonal antibodies are most exposed, implying lower average selling prices for blockbuster cancer drugs within the forecast period. This disruption will lower treatment costs and widen access, but it also raises competitive intensity in therapeutic areas that previously featured only two or three suppliers.
Escalating Prevalence of Chronic and Autoimmune Diseases
Chronic and autoimmune diseases are surging worldwide, and specialty medicines already account for over half of U.S. prescription expenditure. Consequently, biosimilars targeting these conditions represent the fastest-growing indication cohort, clocking a 23% CAGR from 2025-2030. The inference from rising prevalence data is that payer budgets will come under mounting strain even if biosimilars achieve double-digit market share gains, because absolute patient numbers are rising in parallel. Oncology remains the largest revenue pool today, but autoimmune prescriptions are narrowing that gap as diagnosis rates climb. Real-world evidence from programs in Brazil shows cost savings exceeding 50% when stable patients are switched, suggesting that similar outcomes could surface in other emerging markets. Steady patient migration toward long-term maintenance therapies heightens the commercial attractiveness of chronic-disease biosimilars and incentivizes investment in subcutaneous formulations.
Intrinsic Manufacturing and Analytical Complexity
Developing a biosimilar still costs USD 100-300 million and takes as long as seven to eight years because each molecule must undergo more than 40 orthogonal analytical tests. An inference from these numbers is that capital rationing will steer smaller developers toward narrow, high-value niches rather than broad portfolios. Mammalian cell culture, particularly Chinese Hamster Ovary (CHO) lines, remains the production workhorse because of its human-like glycosylation profile. Complexity rises further when developers target antibody-drug conjugates or fusion proteins, both of which are beginning to surface in pipeline disclosures. Analytical challenges, including glycan profiling and charge variant analysis, require expensive instrumentation, pushing many firms to outsource to specialized CDMOs. High failure rates-hovering around 50 % for late-stage biosimilar programs-signal that expertise, rather than capital alone, determines success probabilities.
Other drivers and restraints analyzed in the detailed report include:
- Growing Clinician and Patient Confidence Driven by Real-World Evidence
- Rising Capital Investment, Strategic Alliances, and CMO/CDMO Capacity Expansions
- Ongoing Interchangeability and Substitution Skepticism in Certain Healthcare Systems
For complete list of drivers and restraints, kindly check the Table Of Contents.
Segment Analysis
The biosimilar market size for monoclonal antibodies stands at 47.35 % of total revenue in 2025, and while their aggregate CAGR moderates to the mid-teens, absolute sales continue to rise. One inference is that share leadership masks underlying fragmentation, as dozens of mAb targets now split manufacturer focus. Low-molecular-weight heparins are growing at 20.25% CAGR, signaling that anticoagulation may become the next competitive battleground. FDA approval of five ustekinumab biosimilars in 2024 underscores how clustering of launches compresses price points and may shorten product life cycles for each successive entrant. Developers are prioritizing mAbs such as rituximab and bevacizumab because clinical endpoints are well established, reducing comparative study scope. Yet, emerging bispecific antibodies could complicate future equivalence work, nudging regulators to refine guidelines yet again.
The oncology segment accounts for 54.30% biosimilar market share in 2025, commanding the largest slice of reimbursement budgets. An immediate inference is that oncology payers possess the greatest leverage to enforce switching, thereby accelerating penetration. Autoimmune and inflammatory diseases post a 22.10% forecast CAGR, which implies that by 2031 the revenue gap between the two indications could narrow considerably. Upcoming biosimilar launches targeting checkpoint inhibitors like Yervoy hint at a second-order effect: if expensive immuno-oncology drugs see biosimilar erosion, the savings could fund broader use of precision therapies. In turn, that dynamic may push innovators toward even more complex biologic constructs, renewing the innovation cycle.
Geography Analysis
Europe continues to lead with 36.65 % biosimilar market share, reflecting its pioneering 2006 regulatory path and coordinated procurement policies. Many EU member states have instituted gain-sharing schemes, channeling savings back to hospital budgets, which encourages prescriber engagement. The inference is that Europe's mature infrastructure now operates as a test-bed for advanced contracting models, such as multi-winner tenders that preserve supplier diversity. Infliximab case studies show that originator prices fell sharply when biosimilars arrived, proving competition works even in specialty therapeutics. The region faces a triple set of loss-of-exclusivity events that will accelerate biosimilar penetration but could also intensify price erosion beyond comfortable thresholds for smaller manufacturers.
Asia-Pacific is the fastest-growing territory at a projected 23.10 % CAGR, catalyzed by South Korean giants Samsung Bioepis and Celltrion and by China's regulatory reforms. An inference from capacity figures is that Asia is evolving from a contract-manufacturing hub into a design-and-development powerhouse, as evidenced by the localization of clinical trial infrastructure. India leverages its generics heritage to fast-track biosimilar filings, while Australia and Japan are investing in domestic bioproduction for supply-chain resilience. The pandemic accelerated government incentives for biologics self-sufficiency, suggesting that Asia's share of global approvals will rise faster than global demand growth alone would indicate.
North America dominated by the United States lags Europe in penetration yet offers the largest absolute revenue potential, supported by 56 FDA approvals and 41 launches as of July 2024. A notable inference is that Medicare payment reforms embedded in the Inflation Reduction Act (IRA) may realign incentives toward rapid biosimilar switching in public programs. Projected U.S. savings of USD 181 billion over five years underscore the economic stakes. Canadian provincial formularies are also mandating non-medical switches, a policy choice that could harmonize adoption across the continent. Collectively, these factors point to North America overtaking Europe in market size by the early 2030s if current growth differentials persist.
- Pfizer
- Sandoz Group
- Amgen
- Viatris
- Samsung Group
- Celltrion Healthcare
- Eli Lilly and Company
- Biocon Ltd
- Teva Pharmaceutical Industries
- Stada Arzneimittel
- Dr Reddy's Laboratories
- Coherus Biosciences
- LG Chem (LG Life Sciences)
- Intas Pharmaceutical
- Fresenius
- Alvotech
- Bio-Thera Solutions
- Shanghai Henlius Biotech
- Lupin
- Hikma Pharmaceuticals
Additional Benefits:
- The market estimate (ME) sheet in Excel format
- 3 months of analyst support
TABLE OF CONTENTS
1 Introduction
- 1.1 Study Assumptions & Market Definition
- 1.2 Scope of the Study
2 Research Methodology
3 Executive Summary
4 Market Landscape
- 4.1 Market Overview
- 4.2 Market Drivers
- 4.2.1 Imminent Patent Expiry Of Multiple Blockbuster Biologics
- 4.2.2 Escalating Prevalence Of Chronic And Autoimmune Diseases
- 4.2.3 Global Cost-Containment Mandates And Tender-Based Procurement Models
- 4.2.4 Growing Clinician And Patient Confidence Driven By Real-World Evidence
- 4.2.5 Rising Capital Investment, Strategic Alliances, And Cmo/Cdmo Capacity Expansions
- 4.2.6 Increasing Demand Due To Cost-Effectiveness
- 4.3 Market Restraints
- 4.3.1 Intrinsic Manufacturing And Analytical Complexity
- 4.3.2 Ongoing Interchangeability And Substitution Skepticism In Certain Healthcare Systems
- 4.3.3 Originator Defensive Tactics-Patent Litigation, Rebate Walls, And Brand-Loyalty Programs
- 4.3.4 Severe Price Erosion And Narrow Margins
- 4.4 Value-Chain Analysis
- 4.5 Regulatory Outlook
- 4.6 Porter's Five Forces Analysis
- 4.6.1 Threat of New Entrants
- 4.6.2 Bargaining Power of Buyers
- 4.6.3 Bargaining Power of Suppliers
- 4.6.4 Threat of Substitutes
- 4.6.5 Competitive Rivalry
5 Market Size & Growth Forecasts (Value)
- 5.1 By Product Class
- 5.1.1 Monoclonal Antibodies
- 5.1.2 Recombinant Hormones (EPO, G-CSF)
- 5.1.3 Insulins
- 5.1.4 Low-Molecular-Weight Heparins
- 5.1.5 Fusion Proteins & Others
- 5.2 By Indication
- 5.2.1 Oncology
- 5.2.2 Autoimmune & Chronic Inflammatory
- 5.2.3 Metabolic Disorders
- 5.2.4 Blood & Coagulation Disorders
- 5.2.5 Others
- 5.3 By End-user
- 5.3.1 Hospitals
- 5.3.2 Specialty Clinics
- 5.3.3 Retail & Mail-Order Pharmacies
- 5.4 By Manufacturing Type
- 5.4.1 In-house
- 5.4.2 Contract/Outsourced (CMO/CDMO)
- 5.5 By Route of Administration
- 5.5.1 Intravenous
- 5.5.2 Sub-cutaneous
- 5.6 By Geography
- 5.6.1 North America
- 5.6.1.1 United States
- 5.6.1.2 Canada
- 5.6.1.3 Mexico
- 5.6.2 Europe
- 5.6.2.1 Germany
- 5.6.2.2 United Kingdom
- 5.6.2.3 France
- 5.6.2.4 Italy
- 5.6.2.5 Spain
- 5.6.2.6 Rest of Europe
- 5.6.3 Asia-Pacific
- 5.6.3.1 China
- 5.6.3.2 Japan
- 5.6.3.3 India
- 5.6.3.4 South Korea
- 5.6.3.5 Australia
- 5.6.3.6 Rest of Asia-Pacific
- 5.6.4 Middle East
- 5.6.4.1 GCC
- 5.6.4.2 South Africa
- 5.6.4.3 Rest of Middle East
- 5.6.5 South America
- 5.6.5.1 Brazil
- 5.6.5.2 Argentina
- 5.6.5.3 Rest of South America
- 5.6.1 North America
6 Competitive Landscape
- 6.1 Market Concentration
- 6.2 Strategic Moves
- 6.3 Market Share Analysis
- 6.4 Company Profiles (includes Global-level Overview, Market-level Overview, Core Segments, Financials as available, Strategic Information, Market Rank/Share, Products & Services, Recent Developments)
- 6.4.1 Pfizer Inc.
- 6.4.2 Sandoz
- 6.4.3 Amgen Inc.
- 6.4.4 Viatris Inc.
- 6.4.5 Samsung Bioepis Co. Ltd
- 6.4.6 Celltrion Healthcare
- 6.4.7 Eli Lilly and Company
- 6.4.8 Biocon Ltd
- 6.4.9 Teva Pharmaceutical Industries Ltd
- 6.4.10 Stada Arzneimittel AG
- 6.4.11 Dr Reddy's Laboratories
- 6.4.12 Coherus Biosciences Inc.
- 6.4.13 LG Chem (LG Life Sciences)
- 6.4.14 Intas Pharmaceuticals Ltd
- 6.4.15 Fresenius Kabi
- 6.4.16 Alvotech
- 6.4.17 Bio-Thera Solutions
- 6.4.18 Shanghai Henlius Biotech
- 6.4.19 Lupin Ltd
- 6.4.20 Hikma Pharmaceuticals PLC
7 Market Opportunities & Future Outlook
- 7.1 White-space & Unmet-Need Assessment

