
PUBLISHER: Mordor Intelligence | PRODUCT CODE: 2061580

PUBLISHER: Mordor Intelligence | PRODUCT CODE: 2061580
Non-Lethal Weapons - Market Share Analysis, Industry Trends & Statistics, Growth Forecasts (2026 - 2031)
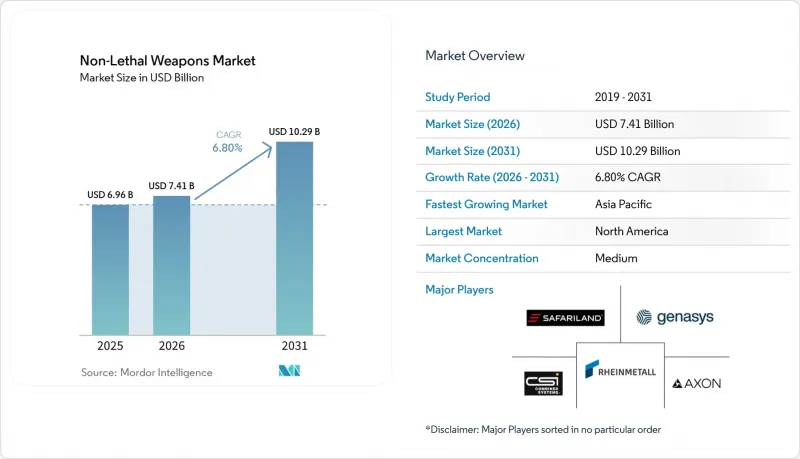
According to Mordor Intelligence, the non-lethal weapons market size is expected to grow from USD 6.96 billion in 2025 to USD 7.41 billion in 2026 and is forecasted to reach USD 10.29 billion by 2031 at an 6.80% CAGR over 2026-2031.
This report is Segmented by Product Type (Area Denial, Ammunition, and More), End User (Law Enforcement and Military), Range (Short, Medium, and Long), Application (Crowd Control, Border Security, Personal Self-Defense, and Perimeter Security), and Geography (North America, Europe, Asia-Pacific, South Africa, and the Middle East and Africa). The Market Forecasts are Provided in Terms of Value (USD).
Global Non-Lethal Weapons Market Trends and Insights
Law-Enforcement Modernization and De-Escalation Mandates
Police reform statutes in the US and the European Union (EU) now link federal or bloc funding to demonstrated use of proportional-force capabilities. This has prompted agencies to expand their inventories to include conducted-energy weapons, impact rounds, and chemical irritants. Training programs now prioritize verbal engagement as the initial response, followed by staged less-lethal measures, leading to a reallocation of budgets from firearms training to certification on these new tools. Larger departments are increasingly adopting integrated platforms that record every trigger pull and upload footage for supervisory review, a feature that remains financially challenging for smaller rural agencies. The ongoing mandate cycle is anticipated to drive new procurement opportunities through 2028, after which replacement programs are expected to take precedence. This policy-driven demand serves as a key growth driver for the non-lethal weapons market.
Rising Civil Unrest and Crowd-Management Demand
Global demonstrations surged during 2024-2025, ranging from pension protests in France to economic marches in Chile, prompting police forces to reevaluate their crowd-control equipment. Urban density restricts tactical maneuverability, leading commanders to prioritize long-range acoustic devices and pepper-spray drones to disperse crowds without direct physical engagement. Procurement agencies increased stockpiles of rubber bullets, tear-gas canisters, and water cannons after earlier unrest led to supply shortages. However, public health advocates have raised concerns about potential respiratory and auditory harm, leading some city councils to impose restrictions on deployment hours. Despite this scrutiny, recurring protests continue to drive demand in the non-lethal weapons market, with a focus on rapid-delivery contracts.
Human-Rights, Liability, and Regulatory Constraints on Specific NLW Classes
Amnesty International reported eye and chest injuries caused by rubber bullets during demonstrations in 2024, leading to calls for comprehensive bans on kinetic impact munitions. The European Committee for the Prevention of Torture has proposed injury-threshold testing as a prerequisite for introducing any new less-lethal weapon models into service within member states. In 2025, US municipalities faced multi-million-dollar settlements stemming from the misuse of tasers and projectiles, prompting insurers to raise premiums or exclude coverage altogether. As a result, vendors must navigate a complex landscape of approval laboratories and disclosure regulations, which increase costs and delay product launch timelines. This heightened regulatory oversight has constrained the short-term growth potential for certain segments of the non-lethal weapons market.
Other drivers and restraints analyzed in the detailed report include:
- Dual-Use Adoption in Defense, Homeland Security, and Border Operations
- Technology Advances: Directed Energy, Acoustic-Hailing, Smart Munitions
- Effectiveness Variability and Training Gaps Across Agencies
For complete list of drivers and restraints, kindly check the Table Of Contents.
Segment Analysis
Ammunition accounted for 26.91% of the non-lethal weapons market share in 2025. However, directed-energy platforms are projected to grow at a CAGR of 12.43% through 2031, marking the fastest growth among all product categories. Legacy rubber and plastic rounds continue to dominate daily riot control operations due to their compatibility with widely deployed 40 mm and 12-gauge launchers. Nonetheless, law enforcement agencies increasingly view beam systems as a strategic upgrade, as these systems eliminate the need for projectile resupply and reduce the risk of accidental harm to bystanders. Electroshock weapons remain a key segment, supported by Axon's TASER product line, which integrates real-time firing logs with cloud-based video storage, meeting oversight boards' demands for comprehensive evidence trails.
The adoption of directed-energy systems is accelerating as defense ministries approve vehicle-mounted Active Denial units for applications such as base perimeter security and maritime interdiction. Smart munitions are also gaining traction, with innovations like GPS-enabled tear-gas canisters and self-diagnosing flash-bangs addressing the accuracy and reliability issues of earlier designs. Additionally, new market entrants, such as Byrna, are introducing CO2-powered handheld launchers that do not require firearms licenses, thereby expanding access for civilians and smaller agencies. As a result, product portfolios are diverging into two distinct categories: low-cost kinetic solutions and premium electronic or beam-based options, each catering to specific user needs within the broader non-lethal weapons market.
Law enforcement organizations accounted for 64.90% of the projected 2025 revenue. However, the military segment is expected to achieve a 7.12% CAGR through 2031, driven by the growing need for scalable forces under the urban operations doctrine. The non-lethal weapons market allocated to infantry and gendarmerie units expands during peacekeeping missions or migrant-border surges, which require proportional engagement. The US and NATO forces have integrated active-denial systems and acoustic-hailing devices into patrol vehicles. At the same time, special operations teams have standardized the use of low-flash diversionary grenades for hostage rescue operations.
Procurement challenges in the defense sector are significant, requiring ruggedization, cybersecurity enhancements, and multi-service interoperability. However, once platforms pass testing, procurement contracts typically span five- to seven-year budget cycles, ensuring stable vendor revenue. Homeland security branches increasingly blur the line between civil and military applications by adopting military-grade bean-bag and pepper-ball rounds for border patrol operations, supporting the dual-use concept. Additionally, private security and corrections sectors contribute niche demand for compact electroshock and irritant devices, which help mitigate litigation risks in confined environments, thereby diversifying the customer base.
Geography Analysis
North America accounted for 36.95% of the projected 2025 revenue, driven by consistent procurement from US federal, state, and municipal agencies. These agencies bundle conducted-energy weapons with cloud-evidence suites and place recurring ammunition orders through the Department of Homeland Security (DHS). Canada continues to follow US use-of-force protocols, advancing nationwide taser deployments, while Mexican federal police procure sponge grenades and OC sprays for cartel-interdiction operations. The region benefits from the highest per-officer equipment budgets globally. However, growth is slowing as many large departments transition from initial purchases to cyclical upgrades, keeping the near-term CAGR below the global average.
The Asia-Pacific region is expected to grow at a 7.17% CAGR through 2031, the fastest among all regions. This growth is fueled by modernization initiatives in China, India, Japan, and South Korea, focusing on riot police equipment and border barrier technologies. In 2025, China's Ministry of Public Security bulk-ordered water-cannon vehicles and electroshock batons, deploying them in Hong Kong and Xinjiang. India's Central Reserve Police Force updated tear-gas and pepper-ball inventories for use in protest-prone areas. Meanwhile, Japan and South Korea installed long-range acoustic devices at airport perimeters and naval bases. Domestic sourcing regulations and price sensitivity continue to limit Western vendors' market penetration. However, the addressable market for non-lethal weapons in the Asia-Pacific is expanding due to increasing urban population density and cross-border tensions.
Europe, South America, and the Middle East and Africa collectively account for the remaining market share. In Europe, the European Union's strict proportional-force doctrine sustains demand for smart munitions that log impact energy. However, new REACH chemical regulations are slowing sales of CS and OC agents. In South America, Brazil leads in volume, equipping military police with rubber rounds and flash-bangs to secure stadiums ahead of the 2026 FIFA World Cup. In the Middle East, Gulf Cooperation Council states are increasing perimeter security budgets and purchasing millimeter-wave active denial trucks and acoustic-hailing towers to protect oil terminals without resorting to lethal measures. Africa remains an emerging market, with UN peacekeeping missions introducing tasers and tear-gas drones in Nigeria and the Sahel, creating long-term growth opportunities for the non-lethal weapons market.
- Axon Enterprise, Inc.
- Safariland, LLC
- Combined Systems, Inc.
- United Tactical Systems, LLC
- Rheinmetall AG
- FN HERSTAL (FN Browning Group)
- Condor Non-Lethal Technologies (EDGE Group PJSC)
- Genasys Inc.
- Byrna Technologies Inc.
- Pacem Solution International, LLC
- Sage Control Ordnance, Inc.
- NonLethal Technologies, Inc.
- Lamperd Less Lethal, Inc.
- Lightfield Ammunition Corporation
- Mace Security International, Inc.
- Zarc International, Inc.
Additional Benefits:
- The market estimate (ME) sheet in Excel format
- 3 months of analyst support
TABLE OF CONTENTS
1 INTRODUCTION
- 1.1 Study Assumptions and Market Definition
- 1.2 Scope of the Study
2 RESEARCH METHODOLOGY
3 EXECUTIVE SUMMARY
4 MARKET LANDSCAPE
- 4.1 Market Overview
- 4.2 Market Drivers
- 4.2.1 Law-enforcement modernization and de-escalation mandates
- 4.2.2 Rising civil unrest and crowd-management demand
- 4.2.3 Dual-use adoption in defense, homeland security, and border operations
- 4.2.4 Technology advances: directed energy, acoustic hailing, smart munitions
- 4.2.5 Litigation and insurance pressures favoring less-lethal force options
- 4.2.6 Evidence ecosystem integration (bodycams, auto-reporting) accelerates CEW procurement
- 4.3 Market Restraints
- 4.3.1 Human-rights, liability, and regulatory constraints on specific NLW classes
- 4.3.2 Effectiveness variability and training gaps across agencies
- 4.3.3 Environmental and chemical restrictions on irritants and carriers
- 4.3.4 Public pushback on acoustic/energy devices over health impacts
- 4.4 Value Chain Analysis
- 4.5 Regulatory Landscape
- 4.6 Technological Outlook
- 4.7 Porter's Five Forces Analysis
- 4.7.1 Bargaining Power of Buyers
- 4.7.2 Bargaining Power of Suppliers
- 4.7.3 Threat of New Entrants
- 4.7.4 Threat of Substitutes
- 4.7.5 Competitive Rivalry
5 MARKET SIZE AND GROWTH FORECASTS (VALUE)
- 5.1 By Product Type
- 5.1.1 Area Denial
- 5.1.1.1 Anti-vehicle
- 5.1.1.2 Anti-personnel
- 5.1.2 Ammunition
- 5.1.2.1 Rubber Bullets
- 5.1.2.2 Wax Bullets
- 5.1.2.3 Plastic Bullets
- 5.1.2.4 Bean Bag Rounds
- 5.1.2.5 Sponge Grenade
- 5.1.3 Explosives
- 5.1.3.1 Flash Bang Grenades
- 5.1.3.2 Sting Grenades
- 5.1.4 Gases and Sprays
- 5.1.4.1 Water Cannons
- 5.1.4.2 Scent-based Weapons
- 5.1.4.3 Tear Gas
- 5.1.4.4 Pepper Spray
- 5.1.5 Directed Energy Weapons
- 5.1.6 Electroshock Weapons
- 5.1.1 Area Denial
- 5.2 By End User
- 5.2.1 Law Enforcement
- 5.2.2 Military
- 5.3 By Range
- 5.3.1 Short (Less than 30 m)
- 5.3.2 Medium (30 to 100 m)
- 5.3.3 Long (Greater than 100 m)
- 5.4 By Application
- 5.4.1 Crowd Control
- 5.4.2 Border Security
- 5.4.3 Personal Self-Defense
- 5.4.4 Perimeter Security
- 5.5 By Geography
- 5.5.1 North America
- 5.5.1.1 United States
- 5.5.1.2 Canada
- 5.5.1.3 Mexico
- 5.5.2 Europe
- 5.5.2.1 United Kingdom
- 5.5.2.2 France
- 5.5.2.3 Germany
- 5.5.2.4 Italy
- 5.5.2.5 Rest of Europe
- 5.5.3 Asia-Pacific
- 5.5.3.1 China
- 5.5.3.2 India
- 5.5.3.3 Japan
- 5.5.3.4 South Korea
- 5.5.3.5 Rest of Asia-Pacific
- 5.5.4 South America
- 5.5.4.1 Brazil
- 5.5.4.2 Rest of South America
- 5.5.5 Middle East and Africa
- 5.5.5.1 Middle East
- 5.5.5.1.1 Saudi Arabia
- 5.5.5.1.2 United Arab Emirates
- 5.5.5.1.3 Rest of Middle East
- 5.5.5.2 Africa
- 5.5.5.2.1 South Africa
- 5.5.5.2.2 Rest of Africa
- 5.5.5.1 Middle East
- 5.5.1 North America
6 COMPETITIVE LANDSCAPE
- 6.1 Market Concentration
- 6.2 Strategic Moves
- 6.3 Market Share Analysis
- 6.4 Company Profiles (includes Global level Overview, Market level overview, Core Segments, Financials as available, Strategic Information, Market Rank/Share for key companies, Products and Services, and Recent Developments)
- 6.4.1 Axon Enterprise, Inc.
- 6.4.2 Safariland, LLC
- 6.4.3 Combined Systems, Inc.
- 6.4.4 United Tactical Systems, LLC
- 6.4.5 Rheinmetall AG
- 6.4.6 FN HERSTAL (FN Browning Group)
- 6.4.7 Condor Non-Lethal Technologies (EDGE Group PJSC)
- 6.4.8 Genasys Inc.
- 6.4.9 Byrna Technologies Inc.
- 6.4.10 Pacem Solution International, LLC
- 6.4.11 Sage Control Ordnance, Inc.
- 6.4.12 NonLethal Technologies, Inc.
- 6.4.13 Lamperd Less Lethal, Inc.
- 6.4.14 Lightfield Ammunition Corporation
- 6.4.15 Mace Security International, Inc.
- 6.4.16 Zarc International, Inc.
7 MARKET OPPORTUNITIES AND FUTURE OUTLOOK
- 7.1 White-space and Unmet-Need Assessment

