
PUBLISHER: Mordor Intelligence | PRODUCT CODE: 2061624

PUBLISHER: Mordor Intelligence | PRODUCT CODE: 2061624
Multiple Sclerosis Therapeutics - Market Share Analysis, Industry Trends & Statistics, Growth Forecasts (2026 - 2031)
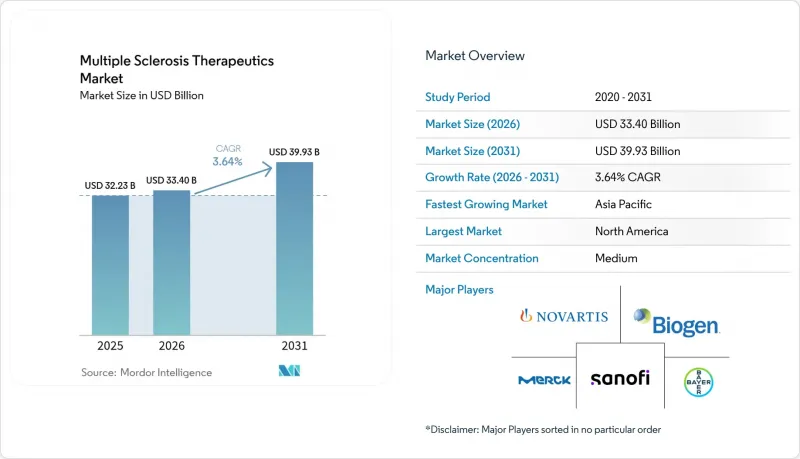
According to Mordor Intelligence, the multiple sclerosis therapeutics market size is projected to expand from USD 32.23 billion in 2025 and USD 33.40 billion in 2026 to USD 39.93 billion by 2031, registering a CAGR of 3.64% between 2026 to 2031.
This report is Segmented by Drug Type (Large-Molecule, Small-Molecule), Route (Oral, Injectable, Others), Indication (RRMS, SPMS, PPMS, CIS), Drug Class (Immunomodulators, Monoclonal Antibodies, S1P Modulators, Antineoplastics/Others), Distribution Channel (Hospital, and More), and Geography (North America, Europe, Asia-Pacific, MEA, South America). Market Forecasts are in Value (USD).
Global Multiple Sclerosis Therapeutics Market Trends and Insights
Rising Global Prevalence of MS
Diagnosed multiple sclerosis cases surpassed 2.8 million globally in 2024, driven by broader MRI access and the wider use of updated diagnostic criteria that capture earlier disease activity. Prevalence remains highest at higher latitudes, while incidence is accelerating in fast-urbanizing regions that face overlapping risks from lower vitamin D exposure, pollution, and Epstein-Barr virus seroprevalence among susceptible populations.
Companies are staging launches to align with this distribution, prioritizing originator biologics where prevalence is dense and using biosimilars or generics where budget pressure is stronger, and diagnosis ramps faster. Partnerships with radiology and neurology networks are becoming a route to earlier patient capture, longer therapy duration, and greater lifetime value per patient in the studied market. The market also benefits from clinician education programs that standardize early workups around MRI and serum markers and prompt referral pathways, thereby hastening treatment initiation. These epidemiology-linked actions support steadier volumes, helping cushion pricing cycles over the forecast period.
Shift Toward High-Efficacy Monoclonal-Antibody DMTs
Regulators cleared multiple monoclonal antibodies for relapsing MS in 2024-2025, with approvals anchored in robust reductions in annualized relapse rates and strong MRI lesion suppression. Clinical practice shifted toward earlier use of high-efficacy therapies for patients with aggressive early disease, reducing the median time to initiation to 1.8 years in 2025. Subcutaneous formulations of ocrelizumab and ofatumumab, approved in 2024, enabled home administration under nurse supervision and removed infusion-center bottlenecks in thinly resourced settings. Payer coverage trends for these agents often track digital supports that verify dosing and persistence, which now factor into reimbursement discussions in the multiple sclerosis therapeutics market. As physicians increasingly match therapy to early disease severity, value propositions emphasize disability slowing and reduced acute-care events, which resonate in cost-effectiveness models. This use of high-efficacy treatment earlier in the course of care supports sustained adoption over the forecast period.
Adverse-Event Profile of Immunosuppressive DMTs
CD20 and alpha 4 integrin monoclonal antibodies carry risks that require structured monitoring and risk-mitigation steps, including screening for JC virus and heightened imaging vigilance for progressive multifocal leukoencephalopathy. Regulators specify safety programs and label updates that guide vaccination scheduling and infection surveillance, thereby increasing the complexity of care coordination for prescribers. The need for frequent lab work and imaging adds cost that can deter selection for patients with known risk markers, even when efficacy is persuasive. Post-marketing pharmacovigilance records document serious infections associated with immunosuppression, which trigger periodic label refinements and practice advisories.
Other drivers and restraints analyzed in the detailed report include:
- Rapid Uptake of Once-Daily Oral DMTs
- Pipeline of CNS-Penetrant BTK Inhibitors
- High Treatment Cost and Payer Pressure
For complete list of drivers and restraints, kindly check the Table Of Contents.
Segment Analysis
Large-molecule drugs accounted for 58.60% of revenue in 2025 and are projected to grow at 7.50% annually through 2031, driven by subcutaneous formats and care models that support home administration with nurse oversight. antibodies dominate the biologics mix, with twice-yearly or monthly dosing that reduces day-to-day decision-making load, helping persistence and reducing acute care utilization tied to relapses. The multiple sclerosis therapeutics market favors large-molecule platforms that align with payer requirements for real-world data capture through connected devices and patient-reported outcome tools. Small molecules remain strategically important where oral convenience and rapid initiation can open access for new starts that avoid injection hesitancy. As digital adherence moves into packaging and hub services, manufacturers emphasize integration that simplifies verification for coverage and reimbursement.
In 2025, injectables dominated the revenue landscape, capturing 48.02% of the market share. This highlights the established role of therapies like interferons, glatiramer acetate, and infusion-based antibodies, all of which require controlled administration settings. Meanwhile, oral therapies are projected to grow at a rate of 8.50%, more than double the overall CAGR. A significant factor driving this growth is the appeal of once-daily S1P modulators, particularly for patients who prefer simplified routines during their initial year of treatment. This trend is further supported by the alignment between patient-reported preferences and real-world adherence data, which strengthens the case for oral therapies, especially when their efficacy is comparable to alternatives. At the same time, subcutaneous monoclonal antibodies are simplifying the treatment process. By reducing the need for infusion visits while maintaining high efficacy, they provide a notable advantage, particularly in regions with limited infusion capacity. These evolving dynamics ensure that injectables remain essential for patients who prioritize less frequent administration along with hands-on clinical monitoring.
Geography Analysis
North America accounted for 41.76% of revenue in 2025, driven by elevated per-patient spending, swift regulatory reviews, and timely payer access decisions. Regional policy discussions now emphasize outcome-linked contracts that partially refund drug costs if real-world disability trends differ from trial results. This focus strengthens the emphasis on verified persistence and functional outcomes. As biosimilars for high-efficacy agents approach their U.S. market debut, originators are shifting attention to device enhancements and supportive ecosystems, differentiating beyond molecule identity. Providers in integrated delivery networks are well-positioned to benefit from adherence-linked reimbursements, given their systems' ability to capture closed-loop data that meets payer audit requirements. These factors keep the Multiple Sclerosis Therapeutics market focused on real-world evidence demonstrating system-level value.
Europe captured a significant share of 2025 revenue, with Germany, the U.K., France, Italy, and Spain accounting for the majority of sales. Growth trends reflect a more substantial reliance on reference pricing and managed access to influence net costs. The U.K.'s National Institute for Health and Care Excellence has tightened cost-effectiveness thresholds, requiring evidence aligned with real-world outcomes and adherence documentation for positive guidance.
Asia-Pacific is projected to grow at 7.22% through 2031, driven by faster regulatory processes and provincial approvals increasingly aligned with national approvals. During 2024-2025, China approved several novel disease-modifying therapies and moved them into reimbursement pathways more quickly than European timelines, expanding eligible patient pools shortly after launch. Local producers in India have scaled older platforms for export, supporting access in regions with constrained branded pricing, while innovators defend their market share through device patents and support services. Urban centers across the Asia-Pacific are well-suited to pilot AI-enabled adherence platforms, given the growing interoperability of pharmacy claims and EHR data across major hospital networks. These trends indicate that the Multiple Sclerosis Therapeutics market in Asia-Pacific will continue to combine regulatory speed with digital adoption over the forecast period.
- Abbvie
- Acorda Therapeutics
- Bayer
- Biogen
- Bristol-Myers Squibb
- Celgene Corp.
- Roche
- GlaxoSmithKline
- InnoCare Pharma
- Johnson & Johnson Services, Inc. (Janssen)
- MediciNova Inc.
- Merck
- Mitsubishi Tanabe Pharma
- Novartis
- Pfizer
- Sanofi
- Teva Pharmaceutical Industries
- TG Therapeutics Inc.
- Tiziana Life Sciences PLC
- Viatris
Additional Benefits:
- The market estimate (ME) sheet in Excel format
- 3 months of analyst support
TABLE OF CONTENTS
1 Introduction
- 1.1 Study Assumptions & Market Definition
- 1.2 Scope of the Study
2 Research Methodology
3 Executive Summary
4 Market Landscape
- 4.1 Market Overview
- 4.2 Market Drivers
- 4.2.1 Rising Global Prevalence of MS
- 4.2.2 Shift Toward High-Efficacy Monoclonal-Antibody DMTs
- 4.2.3 Broader Reimbursement & Access Programs in OECD Markets
- 4.2.4 Rapid Uptake of Once-Daily Oral DMTs
- 4.2.5 Pipeline of CNS-Penetrant BTK Inhibitors
- 4.2.6 AI-Driven Adherence Platforms Improving Real-World Persistence
- 4.3 Market Restraints
- 4.3.1 Adverse-Event Profile of Immunosuppressive DMTs
- 4.3.2 High Treatment Cost and Payer Pressure
- 4.3.3 Upcoming Biosimilar Wave Eroding Branded Prices
- 4.3.4 Insufficient Predictive Biomarkers for Therapy Selection
- 4.4 Supply-Chain Analysis
- 4.5 Regulatory Landscape
- 4.6 Technological Outlook
- 4.7 Porters Five Forces Analysis
- 4.7.1 Bargaining Power Suppliers
- 4.7.2 Bargaining Power Buyers
- 4.7.3 Threat of New Entrants
- 4.7.4 Threat of Substitutes
- 4.7.5 Competitive Rivalry
5 Market Size & Growth Forecasts (Value, USD)
- 5.1 By Drug Type
- 5.1.1 Large-molecule Drugs
- 5.1.2 Small-molecule Drugs
- 5.2 By Route of Administration
- 5.2.1 Oral
- 5.2.2 Injectable
- 5.2.3 Others
- 5.3 By Disease Indication
- 5.3.1 Relapsing-Remitting MS (RRMS)
- 5.3.2 Secondary Progressive MS (SPMS)
- 5.3.3 Primary Progressive MS (PPMS)
- 5.3.4 Clinically Isolated Syndrome (CIS)
- 5.4 By Drug Class
- 5.4.1 Immunomodulators
- 5.4.2 Monoclonal Antibodies
- 5.4.3 S1P Receptor Modulators
- 5.4.4 Antineoplastics / Others
- 5.5 By Distribution Channel
- 5.5.1 Hospital Pharmacy
- 5.5.2 Retail Pharmacy
- 5.5.3 Online/Specialty Pharmacy
- 5.6 By Geography
- 5.6.1 North America
- 5.6.1.1 United States
- 5.6.1.2 Canada
- 5.6.1.3 Mexico
- 5.6.2 Europe
- 5.6.2.1 Germany
- 5.6.2.2 United Kingdom
- 5.6.2.3 France
- 5.6.2.4 Italy
- 5.6.2.5 Spain
- 5.6.2.6 Rest of Europe
- 5.6.3 Asia-Pacific
- 5.6.3.1 China
- 5.6.3.2 India
- 5.6.3.3 Japan
- 5.6.3.4 Australia
- 5.6.3.5 South Korea
- 5.6.3.6 Rest of Asia-Pacific
- 5.6.4 Middle East and Africa
- 5.6.4.1 GCC
- 5.6.4.2 South Africa
- 5.6.4.3 Rest of Middle East and Africa
- 5.6.5 South America
- 5.6.5.1 Brazil
- 5.6.5.2 Argentina
- 5.6.5.3 Rest of South America
- 5.6.1 North America
6 Competitive Landscape
- 6.1 Market Concentration
- 6.2 Market Share Analysis
- 6.3 Company Profiles (includes Global level Overview, Market level overview, Core Segments, Financials as available, Strategic Information, Market Rank/Share for key companies, Products & Services, and Recent Developments)
- 6.3.1 AbbVie Inc.
- 6.3.2 Acorda Therapeutics Inc.
- 6.3.3 Bayer AG
- 6.3.4 Biogen Inc.
- 6.3.5 Bristol Myers Squibb Co.
- 6.3.6 Celgene Corp.
- 6.3.7 F. Hoffmann-La Roche AG
- 6.3.8 GSK Plc
- 6.3.9 InnoCare Pharma
- 6.3.10 Johnson & Johnson Services, Inc. (Janssen)
- 6.3.11 MediciNova Inc.
- 6.3.12 Merck KGaA (EMD Serono)
- 6.3.13 Mitsubishi Tanabe Pharma
- 6.3.14 Novartis AG
- 6.3.15 Pfizer Inc.
- 6.3.16 Sanofi
- 6.3.17 Teva Pharmaceutical Industries Ltd.
- 6.3.18 TG Therapeutics Inc.
- 6.3.19 Tiziana Life Sciences PLC
- 6.3.20 Viatris Inc.
7 Market Opportunities & Future Outlook
- 7.1 White-space & Unmet-Need Assessment

