
PUBLISHER: Mordor Intelligence | PRODUCT CODE: 2061638

PUBLISHER: Mordor Intelligence | PRODUCT CODE: 2061638
Commercial Greenhouse - Market Share Analysis, Industry Trends & Statistics, Growth Forecasts (2026 - 2031)
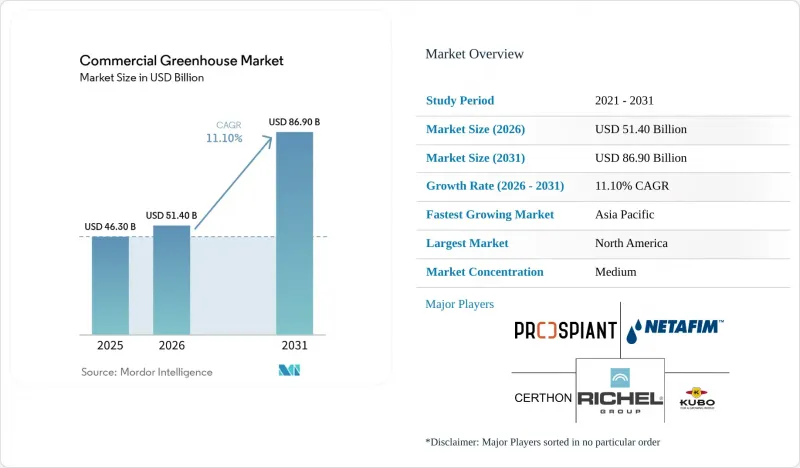
According to Mordor Intelligence, the commercial greenhouse market size is projected to be USD 46.3 billion in 2025, USD 51.4 billion in 2026, and reach USD 86.9 billion by 2031, growing at a CAGR of 11.1% from 2026 to 2031.
This report is Segmented by Equipment Type (Heating Systems, and More), by Crop Type (Fruits and Vegetables, and More), by Greenhouse Type (Glass Greenhouse, and More), by Cultivation Technology (Hydroponic, and More), by End User (Commercial Growers, and More), and by Geography (North America, and More). The Market Forecasts are Provided in Terms of Value (USD).
Global Commercial Greenhouse Market Trends and Insights
Demand for Year-Round Fresh Produce
Retail and food-service procurement now favors consistent year-round supply, which directly supports new investment in the commercial greenhouse market. Large buyers want dependable volumes of tomatoes, cucumbers, lettuce, peppers, berries, and other fresh produce with stable quality and residue control, and greenhouse systems are better positioned to deliver them. The United States Department of Agriculture (USDA) announced USD 1.3 billion in second-round payments under the Marketing Assistance for Specialty Crops program in April 2025, which brought total support under that program to USD 2.65 billion. Grocery consolidation is strengthening this driver because fewer, larger buyers can impose tighter service expectations and stiffer penalties for supply gaps. That shift improves the case for utilization in the commercial greenhouse market because growers with stable output become more valuable to modern supply chains.
Climate-Resilient Production Amid Weather Volatility
Weather volatility has made open-field supply less dependable across several produce-growing regions, prompting buyers to turn to more protected cultivation. This matters to the commercial greenhouse market because extreme heat, drought, flooding, and irregular seasonal patterns raise the value of controlled output more quickly than standard planning models suggest. A February 2026 study in Nature Communications found that controlled-environment systems can remain viable under aggressive climate scenarios when they maximize natural light and carefully manage heating loads. The European Commission reinforced this direction in 2025 with a Horizon Europe work program that included EUR 12.0 million (USD 13 million) for controlled-environment agriculture research. As procurement teams place greater weight on resilience, the commercial greenhouse market benefits, as greenhouse output shifts from backup supply to core supply planning.
High Upfront Capital and Long Payback Periods
Capital intensity remains a clear barrier in the commercial greenhouse market because full high-tech builds can exceed USD 5 million to USD 10 million per hectare when climate systems, lighting, fertigation, and software are included. This makes financing harder in markets where agricultural lending is expensive or where greenhouse cash flow is still viewed as execution sensitive. The challenge intensifies when wholesale vegetable prices decline, as debt servicing does not adjust as rapidly as produce prices. This trend highlights why larger, well-capitalized operators dominate the recent project pipeline in the commercial greenhouse market. While leasing models, platform financing, and energy-as-a-service solutions offer support, the initial financial burden continues to hinder broader adoption.
Other drivers and restraints analyzed in the detailed report include:
- LED Lighting, Sensors, and Climate-Control Automation
- Government Support for Protected Cultivation and Food Security
- Energy-Cost Volatility and Power-Intensity Exposure
For complete list of drivers and restraints, kindly check the Table Of Contents.
Segment Analysis
LED grow lighting accounted for the largest share of the equipment segment in 2025, holding 30.2% of the market, making it the primary revenue generator in the commercial greenhouse market. This dominance reflects a widespread retrofit trend, as growers replace high-pressure sodium (HPS) fixtures with LED systems that provide improved heat management and more precise light delivery. Heating, cooling, and ventilation systems continue to represent a significant expenditure category, as maintaining climate stability remains critical for consistent yields in glass and semi-closed greenhouse operations. Additionally, irrigation and fertigation systems maintain their importance, driven by the increasing focus on water reuse and nutrient precision to enhance cost efficiency and meet regulatory requirements. Structural components are primarily linked to greenfield developments, particularly in regions where new greenhouse complexes are expanding at a faster rate than retrofits.
Climate control and automation software is the fastest-growing equipment category in the commercial greenhouse market size, with a compound annual growth rate (CAGR) of 13.2% during 2026-2031. This growth highlights a shift in value from hardware to crop-performance control. In June 2025, Signify introduced the Philips GrowWise smart spectrum, enabling growers to achieve greater software-controlled spectral settings. During the same period, Signify also launched a new 4-channel fixture platform, which emphasized the connection between lighting upgrades, energy efficiency, and dynamic control. Growers increasingly demand integrated solutions that combine lighting, irrigation, climate, and energy data into a unified system, rather than relying on separate tools. This trend is reshaping competition among equipment vendors, favoring those capable of linking devices to measurable crop outcomes instead of offering standalone hardware solutions.
Fruits and vegetables accounted for 55.5% of the commercial greenhouse market share in 2025, representing the largest revenue share among crop groups. Tomatoes, cucumbers, lettuce, and peppers remain the primary products due to their alignment with year-round retail demand and greenhouse economics. Their prominence is also driven by supermarket and food-service contracts, which prioritize consistent sizing, minimal residue exposure, and reliable delivery schedules. This crop mix provides the commercial greenhouse market with a stable demand base, supporting investments in lighting, irrigation, and automation technologies. While flowers and ornamentals continue to play a significant role in high-value horticulture, their demand patterns are more mature and seasonal in nature.
The cannabis and specialty crops segment is the fastest-growing in the commercial greenhouse market, with a projected compound annual growth rate (CAGR) of 14.5% during 2026-2031. Medical cannabis is a key growth driver, as greenhouse environments enable consistency, traceability, and effective residue management in regulated production. Additionally, herbs, microgreens, seedlings, and propagation crops are expanding due to their compatibility with short production cycles and local delivery models. This segment is gaining traction because controlled greenhouse conditions deliver quality advantages that are difficult to achieve through traditional field cultivation. While the crop portfolio is diversifying, fruits and vegetables continue to serve as the primary foundation for operations in the commercial greenhouse market.
Geography Analysis
North America accounted for 37.6% of the commercial greenhouse market in 2025. The United States and Canada supported this share through robust retail demand, established grower networks, and a mature base for high-technology vegetable production. The region benefited from government support programs for specialty crops, such as funding under the Marketing Assistance for Specialty Crops initiative and the Specialty Crop Block Grant Program during fiscal 2025. Additionally, tariff pressures and supply chain disruptions drove increased interest in domestic sourcing and shorter supply chains for greenhouse structures and equipment. These factors reinforced North America's leading position in the commercial greenhouse market, though its growth rate was slower than that of emerging markets experiencing rapid expansion.
The Asia-Pacific region was projected to be the fastest-growing market, with a CAGR of 12.4% during 2026-2031. China led this growth through significant investments in smart greenhouse infrastructure. Japan and South Korea remained key markets due to their advanced automation capabilities and demand for environmental control systems and advanced lighting technologies. Additionally, India and several Southeast Asian countries expanded protected cultivation, driven by food-security initiatives, government support programs, and a growing focus on water-efficient agricultural systems.
Europe's growth in the commercial greenhouse market stemmed from technology modernization and energy-transition investments rather than large-scale greenfield greenhouse projects. The Netherlands remained a central player, supported by Rijksdienst voor Ondernemend Nederland (RVO) programs that promoted energy efficiency and innovation in greenhouse horticulture. Spain also played a significant role due to its extensive greenhouse cultivation area and increasing demand for automation, water-efficiency systems, and climate-control upgrades to meet stricter environmental regulations. The Middle East experienced steady growth, driven by rising investments in high-tech greenhouse systems in Saudi Arabia and the United Arab Emirates as part of broader food security strategies. In Africa, gradual expansion was forecast, led by Kenya, South Africa, and Egypt. These countries increasingly adopted protected cultivation to enhance compliance with export quality standards, improve resource efficiency, and optimize water management.
- Gibraltar Industries, Inc.
- Netafim Ltd. (Orbia Advance Corporation, S.A.B. de C.V.)
- Richel Group
- KUBO Greenhouse Projects B.V. (KUBO Group B.V.)
- Certhon Build B.V. (DENSO Corporation)
- Priva Holding B.V.
- Dalsem B.V. (COFRA Holding AG)
- Van der Hoeven Horticultural Projects B.V. (Arvesta NV)
- Ridder
- AB Ludvig Svensson (Ludvigson Invest AB)
- Signify N.V.
- Hoogendoorn Growth Management B.V. (Batenburg Techniek N.V.)
- Palram Industries (1990) Ltd.
- Industries Harnois Inc.
- Argus Control Systems Ltd. (Controlled Environments Limited)
Additional Benefits:
- The market estimate (ME) sheet in Excel format
- 3 months of analyst support
TABLE OF CONTENTS
1 Introduction
- 1.1 Study Assumptions and Market Definition
- 1.2 Scope of the Study
2 Research Methodology
3 Executive Summary
4 Market Landscape
- 4.1 Market Overview
- 4.2 Market Drivers
- 4.2.1 Demand for year-round fresh produce
- 4.2.2 Climate-resilient production amid weather volatility
- 4.2.3 LED lighting, sensors, and climate-control automation
- 4.2.4 Government support for protected cultivation and food security
- 4.2.5 Retailer shelf-life and pesticide-residue requirements
- 4.2.6 Waste-heat, carbon dioxide reuse, and flexible-energy monetization
- 4.3 Market Restraints
- 4.3.1 High upfront capital and long payback periods
- 4.3.2 Energy-cost volatility and power-intensity exposure
- 4.3.3 Interoperability gaps across climate, lighting, and crop-data stacks
- 4.3.4 Water recirculation and discharge compliance costs
- 4.4 Regulatory Landscape
- 4.5 Technological Outlook
- 4.6 Porter's Five Forces Analysis
- 4.6.1 Bargaining Power of Suppliers
- 4.6.2 Bargaining Power of Buyers
- 4.6.3 Threat of New Entrants
- 4.6.4 Threat of Substitutes
- 4.6.5 Intensity of Competitive Rivalry
5 Market Size and Growth Forecasts (Value)
- 5.1 By Equipment Type
- 5.1.1 Heating Systems
- 5.1.2 Cooling and Ventilation Systems
- 5.1.3 LED Grow Lighting
- 5.1.4 Irrigation and Fertigation Systems
- 5.1.5 Climate Control and Automation Software
- 5.1.6 Screening and Shading Systems
- 5.1.7 Structural Components
- 5.1.7.1 Glazing Systems
- 5.1.7.2 Frames and Trusses
- 5.2 By Crop Type
- 5.2.1 Fruits and Vegetables
- 5.2.1.1 Tomatoes
- 5.2.1.2 Cucumbers
- 5.2.1.3 Lettuce and Leafy Greens
- 5.2.1.4 Peppers
- 5.2.1.5 Strawberries and Berries
- 5.2.2 Flowers and Ornamentals
- 5.2.2.1 Cut Flowers
- 5.2.2.2 Potted Plants and Bedding Plants
- 5.2.3 Herbs and Microgreens
- 5.2.4 Cannabis and Specialty Crops
- 5.2.4.1 Medical Cannabis
- 5.2.4.2 Seedlings and Propagation Crops
- 5.2.1 Fruits and Vegetables
- 5.3 By Greenhouse Type
- 5.3.1 Glass Greenhouses
- 5.3.2 Plastic-film Greenhouses
- 5.3.3 Rigid Polycarbonate Greenhouses
- 5.3.4 Hybrid and Semi-closed Greenhouses
- 5.4 By Cultivation Technology
- 5.4.1 Hydroponic
- 5.4.1.1 Nutrient Film Technique
- 5.4.1.2 Deep Water Culture
- 5.4.1.3 Drip Hydroponics
- 5.4.2 Non-hydroponic Soil and Substrate
- 5.4.2.1 Soil-based
- 5.4.2.2 Coco Coir and Rockwool Substrate
- 5.4.3 Hybrid and Vertical Integration
- 5.4.1 Hydroponic
- 5.5 By End User
- 5.5.1 Commercial Growers
- 5.5.2 Research and Educational Institutes
- 5.5.3 Retail Garden Centers and Nurseries
- 5.6 By Geography
- 5.6.1 North America
- 5.6.1.1 United States
- 5.6.1.2 Canada
- 5.6.1.3 Mexico
- 5.6.1.4 Rest of North America
- 5.6.2 South America
- 5.6.2.1 Brazil
- 5.6.2.2 Argentina
- 5.6.2.3 Chile
- 5.6.2.4 Rest of South America
- 5.6.3 Europe
- 5.6.3.1 Netherlands
- 5.6.3.2 Spain
- 5.6.3.3 Germany
- 5.6.3.4 United Kingdom
- 5.6.3.5 France
- 5.6.3.6 Russia
- 5.6.3.7 Rest of Europe
- 5.6.4 Asia-Pacific
- 5.6.4.1 China
- 5.6.4.2 Japan
- 5.6.4.3 India
- 5.6.4.4 South Korea
- 5.6.4.5 Australia
- 5.6.4.6 Rest of Asia-Pacific
- 5.6.5 Middle East
- 5.6.5.1 Saudi Arabia
- 5.6.5.2 United Arab Emirates
- 5.6.5.3 Turkey
- 5.6.5.4 Israel
- 5.6.5.5 Rest of Middle East
- 5.6.6 Africa
- 5.6.6.1 South Africa
- 5.6.6.2 Egypt
- 5.6.6.3 Kenya
- 5.6.6.4 Rest of Africa
- 5.6.1 North America
6 Competitive Landscape
- 6.1 Market Concentration
- 6.2 Strategic Moves
- 6.3 Market Share Analysis
- 6.4 Company Profiles (Includes Global-level Overview, Market-level Overview, Core Segments, Financials as Available, Strategic Information, Market Rank and Share for Key Companies, Products and Services, and Recent Developments)
- 6.4.1 Gibraltar Industries, Inc.
- 6.4.2 Netafim Ltd. (Orbia Advance Corporation, S.A.B. de C.V.)
- 6.4.3 Richel Group
- 6.4.4 KUBO Greenhouse Projects B.V. (KUBO Group B.V.)
- 6.4.5 Certhon Build B.V. (DENSO Corporation)
- 6.4.6 Priva Holding B.V.
- 6.4.7 Dalsem B.V. (COFRA Holding AG)
- 6.4.8 Van der Hoeven Horticultural Projects B.V. (Arvesta NV)
- 6.4.9 Ridder
- 6.4.10 AB Ludvig Svensson (Ludvigson Invest AB)
- 6.4.11 Signify N.V.
- 6.4.12 Hoogendoorn Growth Management B.V. (Batenburg Techniek N.V.)
- 6.4.13 Palram Industries (1990) Ltd.
- 6.4.14 Industries Harnois Inc.
- 6.4.15 Argus Control Systems Ltd. (Controlled Environments Limited)
7 Market Opportunities and Future Outlook

