
PUBLISHER: Mordor Intelligence | PRODUCT CODE: 2061639

PUBLISHER: Mordor Intelligence | PRODUCT CODE: 2061639
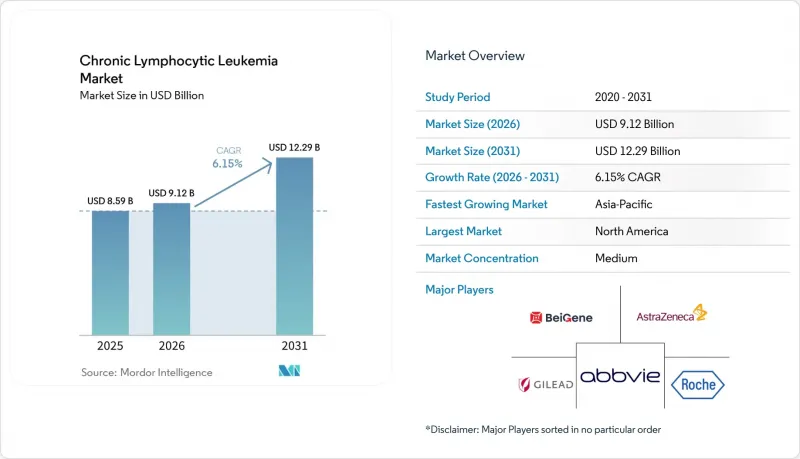
Chronic Lymphocytic Leukemia - Market Share Analysis, Industry Trends & Statistics, Growth Forecasts (2026 - 2031)
According to Mordor Intelligence, the chronic lymphocytic leukemia market size is expected to increase from USD 8.59 billion in 2025 to USD 9.12 billion in 2026 and reach USD 12.29 billion by 2031, growing at a CAGR of 6.15% over 2026-2031.
This report is Segmented by Therapy Class (Chemotherapy, Targeted Therapy, and More), Diagnostics Technology (Flow Cytometry, Molecular Genetic Tests, and More), Route (Oral, IV, SC/IM), Line of Therapy (First-Line, and More), End User (Hospitals, Specialty Clinics, Labs, Pharmacies), and Geography (North America, Europe, and More). Market Forecasts are Provided in Value (USD).
Global Chronic Lymphocytic Leukemia Market Trends and Insights
BTK and BCL-2 Inhibitors Surge Ahead of Chemoimmunotherapy
BTK and BCL-2 inhibitors have become the preferred frontline treatments, replacing traditional chemoimmunotherapy due to their superior five-year progression-free survival rates, simplified oral dosing, and reduced toxicity. The acalabrutinib-venetoclax combination demonstrated an 88% five-year progression-free rate in treatment-naive patients, significantly outperforming the obinutuzumab-chlorambucil regimen. Pirtobrutinib, approved for addressing covalent-inhibitor resistance, is gaining traction as first-generation agents increasingly select for C481S mutations in 8-12% of patients annually. The strong efficacy of first-line treatments, combined with effective salvage options, is driving a decline in the chemotherapy segment within the chronic lymphocytic leukemia market.
CLL Cases Surge as Populations Age
With a median diagnosis age of 72, chronic lymphocytic leukemia (CLL) cases are increasing alongside aging populations in industrialized nations. The United States is projected to see 22,760 new cases in 2026, reflecting a 4% rise from 2024. In Europe, 2025 recorded 24,500 new diagnoses, driven by rising life expectancies in countries such as Germany, Italy, and Spain. In China, the incidence of CLL rose by 18% between 2020 and 2025, supported by expanded routine hematology testing in second-tier cities. However, 43% of newly diagnosed Europeans over 75 faced renal or cardiovascular contraindications for venetoclax, underscoring a gap between increasing diagnoses and treatment eligibility. This disparity has prompted the adoption of clinical protocols that adjust doses and schedules based on patient frailty rather than chronological age, aiming to reduce treatment discontinuations.
Escalating Therapy Costs and Payer Hurdles in the U.S.
Annual treatment costs for drugs like venetoclax and zanubrutinib have surged to USD 180,000, leading to the implementation of stringent utilization-management policies. By 2025, U.S. commercial insurers required prior authorization for 78% of BTK inhibitor claims, often demanding evidence of del(17p) or TP53 mutations despite broad FDA approvals. In Brazil, private insurance plans mandate patients to complete two lines of chemotherapy before approving acalabrutinib, delaying access to targeted therapy by an average of 11 months and increasing the risk of Richter transformation. In India, the national health scheme excludes BTK inhibitors entirely, forcing 92% of patients to rely on generic chemotherapy, which reduces three-year overall survival rates to 61% compared to 89% for targeted regimens. While tiered pricing and volume-based government tenders provide partial solutions, they have not fully addressed the access disparity.
Other drivers and restraints analyzed in the detailed report include:
- Next-Gen Oral Regimens Gain Wider Reimbursement
- Companion Diagnostics and Precision Medicine on the Rise
- Resistance Mutations Emerge in First-Generation BTK Inhibitors
For complete list of drivers and restraints, kindly check the Table Of Contents.
Segment Analysis
Immunotherapy and cell therapy are projected to grow at an 8.10% CAGR through 2031, while targeted agents accounted for 46.35% of sales in 2025. In the chronic lymphocytic leukemia therapy market, BTK and BCL-2 inhibitors generated USD 7.2 billion in 2025. However, their market share is declining as bispecific antibodies and allogeneic CAR-T products progress to late-stage trials. The use of bendamustine-rituximab in the U.S. decreased by 34% from 2023 to 2025 due to updated guidelines that relegated chemotherapy to an alternative option. The approval of the acalabrutinib-venetoclax combination in February 2026, which achieved a 67% undetectable MRD rate in patients after 12 months, highlights the shift towards chemotherapy-free treatments and sets a high efficacy standard for future competitors.
Flow cytometry, valued for its quick four-hour turnaround and reimbursement advantages, accounted for 44.23% of diagnostics revenue in 2025. However, next-generation sequencing (NGS) is gaining traction, expanding at a 7.60% CAGR and driving growth in the chronic lymphocytic leukemia diagnostics market. NGS panels, which analyze 300-648 genes, identify mutations in TP53, NOTCH1, SF3B1, and ATM, influencing therapy decisions and trial eligibility, thereby reshaping treatment strategies. A 22% detection rate for TP53 mutations in 2025, double that of traditional methods, underscores the clinical importance of broader panels. While cytogenetics continues to play a niche role in detecting large chromosomal deletions, declining sequencing costs and increased payer coverage are shifting the economic balance in favor of NGS.
Geography Analysis
In 2025, North America, accounting for 39.67% of sales, benefits from Medicare policies that bypass step-therapy requirements and features robust oncology networks that quickly adopt new FDA-approved treatments. The United States led the region, contributing 88% of its revenue, with 18,400 new cases reported in 2025 and a median diagnosis age of 72 years. While Canada's public healthcare system ensures reimbursement for targeted therapies within six months of approval, Mexico's limited coverage drives 76% of its patients toward generic chemotherapy.
Europe, representing 32% of 2025's revenue, is driven by its five largest economies, which generate 71% of the region's turnover. Germany leads in per-capita BTK usage, while Italy and Spain impose annual spending caps on BTK therapies, restricting access to high-risk genomic subsets until the expected availability of generic ibrutinib in 2027. The United Kingdom experienced accelerated adoption after a confidential 35% discount on acalabrutinib for first-line treatment expanded access to an additional 3,200 patients annually.
Asia-Pacific is projected to grow at a CAGR of 8.50% through 2031. China included zanubrutinib in its National Reimbursement Drug List at an annual cost of USD 28,000, driving a significant increase in prescriptions, with the therapy accounting for 28% of all new BTK initiations in Q1 2026. Additionally, population aging contributed to an 18% rise in new cases since 2020, resulting in 12,500 new cases in 2025. In India and Southeast Asia, emerging healthcare networks are introducing genomic testing and day-care infusion centers, gradually addressing infrastructure challenges. The Middle East and Africa, along with South America, each account for approximately 7% of global revenue. Wealthy Gulf states provide funding for BTK inhibitors for their citizens, while other countries in these regions rely on chemotherapy, awaiting reductions in biosimilar prices.
- Abbvie
- Adaptive Biotechnologies
- Amgen
- AstraZeneca
- BeiGene Ltd.
- Bristol-Myers Squibb
- Celgene Corporation (BMS)
- Cyclacel Pharmaceuticals
- Roche
- Gilead Sciences
- Infinity Pharmaceuticals
- Johnson & Johnson
- Merck
- MorphoSys AG
- Novartis
- Ono Pharmaceutical
- Pfizer
- Sanofi
- Secura Bio, Inc.
- Teva Pharmaceutical Industries
- TG Therapeutics
Additional Benefits:
- The market estimate (ME) sheet in Excel format
- 3 months of analyst support
TABLE OF CONTENTS
1 Introduction
- 1.1 Study Assumptions & Market Definition
- 1.2 Scope of the Study
2 Research Methodology
3 Executive Summary
4 Market Landscape
- 4.1 Market Overview
- 4.2 Market Drivers
- 4.2.1 Rapid Uptake of Targeted BTK & BCL-2 Inhibitors
- 4.2.2 Rising CLL Prevalence in Ageing Populations
- 4.2.3 Broader Reimbursement for Next-Gen Oral Regimens
- 4.2.4 Expansion of Companion Diagnostics & Precision Medicine
- 4.2.5 Emergence of Off-The-Shelf Allogeneic CAR-T Platforms
- 4.2.6 AI-Enabled Minimal-Residual-Disease (MRD) Monitoring Tools
- 4.3 Market Restraints
- 4.3.1 Therapy Cost Escalation & Payer Step-Therapy Hurdles
- 4.3.2 Resistance Mutations to First-Gen BTK Inhibitors
- 4.3.3 Limited Specialized Oncology Capacity in Emerging Markets
- 4.3.4 Data-Privacy Concerns in Cloud-Based Genomic Diagnostics
- 4.4 Value / Supply-Chain Analysis
- 4.5 Regulatory Landscape
- 4.6 Technological Outlook
- 4.7 Porter's Five Forces Analysis
- 4.7.1 Threat of New Entrants
- 4.7.2 Bargaining Power of Suppliers
- 4.7.3 Bargaining Power of Buyers
- 4.7.4 Threat of Substitutes
- 4.7.5 Industry Rivalry
5 Market Size & Growth Forecasts (Value, USD)
- 5.1 By Therapy Class
- 5.1.1 Chemotherapy
- 5.1.2 Targeted Therapy (BTK, BCL-2, PI3K, others)
- 5.1.3 Immunotherapy & Cell Therapy (mAbs, CAR-T, bispecifics)
- 5.1.4 Combination Regimens
- 5.2 By Diagnostics Technology
- 5.2.1 Flow Cytometry
- 5.2.2 Molecular Genetic Tests (NGS, PCR panels)
- 5.2.3 FISH & Cytogenetics
- 5.2.4 Immunohistochemistry & Others
- 5.3 By Route of Administration
- 5.3.1 Oral
- 5.3.2 Intravenous
- 5.3.3 Subcutaneous / Intramuscular
- 5.4 By Line of Therapy
- 5.4.1 First-Line / Treatment-Naive
- 5.4.2 Second-Line
- 5.4.3 Relapsed / Refractory
- 5.5 By End User
- 5.5.1 Hospitals & Academic Medical Centers
- 5.5.2 Specialty Oncology Clinics
- 5.5.3 Diagnostic Laboratories
- 5.5.4 Retail & Online Pharmacies
- 5.6 By Geography
- 5.6.1 North America
- 5.6.1.1 United States
- 5.6.1.2 Canada
- 5.6.1.3 Mexico
- 5.6.2 Europe
- 5.6.2.1 Germany
- 5.6.2.2 United Kingdom
- 5.6.2.3 France
- 5.6.2.4 Italy
- 5.6.2.5 Spain
- 5.6.2.6 Rest of Europe
- 5.6.3 Asia-Pacific
- 5.6.3.1 China
- 5.6.3.2 India
- 5.6.3.3 Japan
- 5.6.3.4 South Korea
- 5.6.3.5 Australia
- 5.6.3.6 Rest of Asia-Pacific
- 5.6.4 Middle East & Africa
- 5.6.4.1 GCC
- 5.6.4.2 South Africa
- 5.6.4.3 Rest of Middle East and Africa
- 5.6.5 South America
- 5.6.5.1 Brazil
- 5.6.5.2 Argentina
- 5.6.5.3 Rest of South America
- 5.6.1 North America
6 Competitive Landscape
- 6.1 Strategic Moves
- 6.2 Market Share Analysis
- 6.3 Company Profiles (includes Global level Overview, Market-level Overview, Core Segments, Financials, Strategic Information, Market Rank/Share, Products & Services, Recent Developments)
- 6.3.1 AbbVie Inc.
- 6.3.2 Adaptive Biotechnologies
- 6.3.3 Amgen Inc.
- 6.3.4 AstraZeneca PLC
- 6.3.5 BeiGene Ltd.
- 6.3.6 Bristol Myers Squibb
- 6.3.7 Celgene Corporation (BMS)
- 6.3.8 Cyclacel Pharmaceuticals
- 6.3.9 F. Hoffmann-La Roche AG
- 6.3.10 Gilead Sciences Inc.
- 6.3.11 Infinity Pharmaceuticals
- 6.3.12 Johnson & Johnson (Janssen)
- 6.3.13 Merck & Co., Inc.
- 6.3.14 MorphoSys AG
- 6.3.15 Novartis AG
- 6.3.16 Ono Pharmaceutical Co., Ltd.
- 6.3.17 Pfizer Inc.
- 6.3.18 Sanofi S.A.
- 6.3.19 Secura Bio, Inc.
- 6.3.20 Teva Pharmaceutical Industries Ltd.
- 6.3.21 TG Therapeutics
7 Market Opportunities & Future Outlook
- 7.1 White-space & Unmet-Need Assessment

