PUBLISHER: Mordor Intelligence | PRODUCT CODE: 2061663

PUBLISHER: Mordor Intelligence | PRODUCT CODE: 2061663
Drone Sensor - Market Share Analysis, Industry Trends & Statistics, Growth Forecasts (2026 - 2031)
According to Mordor Intelligence, the drone sensor market size is expected to grow from USD 1.67 billion in 2025 to USD 1.85 billion in 2026 and is forecast to reach USD 3.12 billion by 2031 at 10.95% CAGR over 2026-2031.
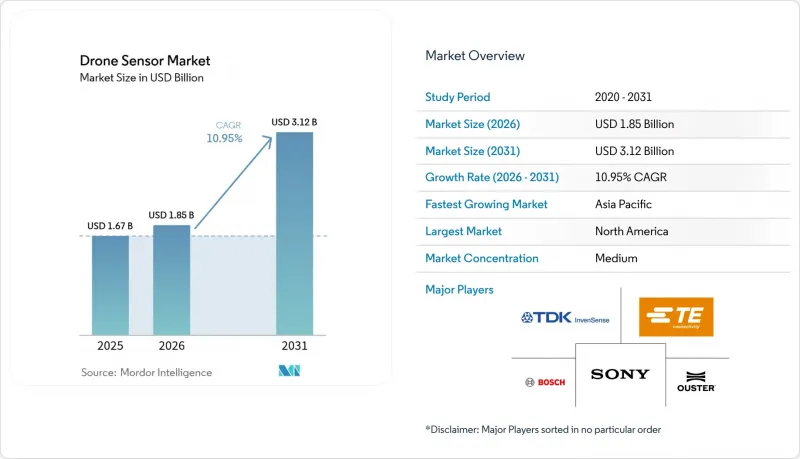
This report is Segmented by Type (Inertial Sensors, Image Sensors, and More), Platform Type (Vertical Take-Off and Landing (VTOL), and More), Application (Navigation and Positioning, Collision Avoidance, and More), End-User Industry (Defense and Security, Agriculture and Forestry, and More), and Geography (North America, Europe, Asia-Pacific, and More). The Market Forecasts are Provided in Terms of Value (USD).
Global Drone Sensor Market Trends and Insights
Rising Autonomy-Ready Sensor-Fusion Demand
Autonomous flight requires coordinated input from inertial, visual, and ranging sensors to maintain accuracy in GPS-denied spaces. Multi-sensor fusion cuts navigation error rates by up to 67% relative to single-sensor baselines, improving BVLOS reliability. Drone makers, therefore, favored pre-validated sensor suites that bundled IMUs, cameras, and LiDAR to shorten development cycles. Commercial operators also adopted redundancy strategies that met civil aviation safety expectations, reinforcing premium demand for fusion-ready modules.
Rapid Miniaturisation and SWaP Optimisation
MEMS IMUs reached tactical-grade performance inside 3 mm X 3 mm packages, enabling integration into nano-drones under 10 g. Advanced packaging, including 3D chip stacking, reduced component counts, and power draw. The resulting 10-fold efficiency gains prolonged flight endurance without increasing battery mass. Manufacturers incorporated novel heat-dissipation materials to offset thermal density, preserving sensor accuracy in compact frames, supporting advancements in the drone sensor market.
High Thermal Drift in MEMS IMUs
Temperature swings pushed drift coefficients to 7 µg/°C in standard accelerometers, forcing complex compensation that raised system cost and power draw. Dual closed-loop control and on-chip heaters improved stability but added weight and design overhead. Long-duration missions remained sensitive to cumulative bias errors, limiting MEMS adoption in high-precision surveying, posing a challenge to the drone sensor market.
Other drivers and restraints analyzed in the detailed report include:
- Mandatory Remote-ID Compliance Deadlines
- Precision-Agriculture Push for Multispectral Sensing
- Rare-Earth Magnetics Supply Bottlenecks
For complete list of drivers and restraints, kindly check the Table Of Contents.
Segment Analysis
In 2025, inertial sensors accounted for 31.75% of the drone sensor market share, owing to their indispensable role in stabilization and navigation across every airframe. Advanced IMUs incorporated bias correction and thermal calibration, sustaining reliability in variable climates. Despite price compression, the segment maintained steady value because each new platform still required multiple inertial nodes. LiDAR units trailed in volume but posted a 12.35% CAGR, reflecting adoption in 3D mapping, obstacle avoidance, and terrain-following tasks.
Accuracy improvements and falling component prices widened LiDAR's addressable market into mid-tier commercial fleets. Single-photon and flash architectures offered centimeter-level resolution at longer ranges, making them viable for corridor inspection and high-density urban missions. Image sensors served aerial photography and security surveillance. In contrast, barometric pressure sensors provided redundancy for altitude hold functions. Emerging gas-analysis payloads entered environmental monitoring niches, though their contribution to the drone sensor market remained small.
VTOL designs held 57.90% of 2025 revenue, reflecting immediate take-off capability and hover stability that simplified sensor alignment and payload swapping. Multi-rotor airframes also support precise waypoint missions essential for infrastructure inspection and cinematic work. Fixed-wing aircraft retained relevance for long-range mapping where endurance trumped agility, but their share plateaued as urban use cases multiplied, shaping trends in the drone sensor market.
Hybrid tilt-rotor concepts recorded a 13.85% CAGR by combining VTOL convenience with aerodynamic cruise efficiency. These platforms presented complex hand-off regimes between rotors and wings, demanding sophisticated flight-control sensors. Vendors embedded redundant IMUs, magnetometers, and high-rate barometers to manage transition phases. Sensor makers, therefore, positioned integrated packages calibrated for dynamic mounting orientations.
Geography Analysis
North America generated 37.25% of 2025 revenue, reflecting early regulatory clarity and strong defense procurement. The Federal Aviation Administration's rule-making provided certainty that guided investment in Remote ID-ready avionics. The United States also prioritized domestic sourcing, encouraging MEMS foundries in Arizona and Texas to scale sensor production under secure-supply programs, strengthening the drone sensor market.
Europe registered steady adoption as EASA progressed toward harmonized BVLOS standards. Germany and France deployed drones for renewable-energy inspections, while the United Kingdom focused on maritime border surveillance. Platform makers leveraged regional LiDAR specialists to meet GDPR and cybersecurity requirements for data handling.
Asia-Pacific outpaced all regions with a 11.75% CAGR, supported by China's manufacturing ecosystem and rising enterprise use in Japan, South Korea, and India. Chinese OEMs shipped high-volume, low-cost sensor sets, but geopolitical tensions accelerated diversification into Southeast Asia and Australia. India's agri-drone subsidies further widened adoption, with domestic startups pairing multispectral cameras and AI chips to boost crop yields. Emerging markets in South America and Africa remained nascent but demonstrated high potential for infrastructure monitoring once regulatory paths mature.
- Bosch Sensortec GmbH (Robert Bosch GmbH)
- Sony Semiconductor Solutions Corporation
- TE Connectivity Corporation
- InvenSense (TDK Corporation)
- Ouster, Inc.
- Trimble Inc.
- Teledyne Technologies Incorporated
- Sparton Corporation
- KVH Industries, Inc.
- Garmin Ltd.
- u-blox AG
- ams-OSRAM AG
- OMNIVISION
- LeddarTech Holdings Inc.
- Infineon Technologies AG
- Septentrio N.V.
Additional Benefits:
- The market estimate (ME) sheet in Excel format
- 3 months of analyst support
TABLE OF CONTENTS
1 INTRODUCTION
- 1.1 Study Assumptions and Market Definition
- 1.2 Scope of the Study
2 RESEARCH METHODOLOGY
3 EXECUTIVE SUMMARY
4 MARKET LANDSCAPE
- 4.1 Market Overview
- 4.2 Market Drivers
- 4.2.1 Rising autonomy-ready sensor-fusion demand
- 4.2.2 Rapid miniaturisation and SWaP optimisation
- 4.2.3 Mandatory Remote-ID compliance deadlines
- 4.2.4 Precision-agriculture push for multispectral sensing
- 4.2.5 Energy-efficient edge-AI co-processor integration
- 4.2.6 Commercial roll-out of mm-wave imaging radar
- 4.3 Market Restraints
- 4.3.1 High thermal drift in MEMS IMUs
- 4.3.2 Rare-earth magnetics supply bottlenecks
- 4.3.3 Spectrum-sharing regulations for 60 GHz radar
- 4.3.4 Short life-cycles due to rapid sensor-interface obsolescence
- 4.4 Value Chain Analysis
- 4.5 Technological Outlook
- 4.6 Regulatory Landscape
- 4.7 Porter's Five Forces Analysis
- 4.7.1 Bargaining Power of Suppliers
- 4.7.2 Bargaining Power of Buyers
- 4.7.3 Threat of New Entrants
- 4.7.4 Threat of Substitutes
- 4.7.5 Intensity of Rivalry
5 MARKET SIZE AND GROWTH FORECASTS (VALUE)
- 5.1 By Sensor Type
- 5.1.1 Inertial Sensors (IMU, Gyro, Accelerometer)
- 5.1.2 Image Sensors
- 5.1.3 Speed and Distance Sensors
- 5.1.4 Position Sensors
- 5.1.5 Pressure and Differential Barometric Sensors
- 5.1.6 Altimeter
- 5.1.7 Flow
- 5.1.8 LiDAR Sensors
- 5.1.9 Others
- 5.2 By Platform Type
- 5.2.1 Vertical Take-Off and Landing (VTOL)
- 5.2.2 Fixed-wing
- 5.2.3 Hybrid
- 5.3 By Application
- 5.3.1 Navigation and Positioning
- 5.3.2 Collision Avoidance
- 5.3.3 Aerial Mapping and Surveying
- 5.3.4 Environmental and Atmospheric Monitoring
- 5.3.5 Payload Handling and Delivery Assistance
- 5.3.6 Others (Cinematography, Inspection)
- 5.4 By End-user Industry
- 5.4.1 Defense and Security
- 5.4.2 Agriculture and Forestry
- 5.4.3 Energy and Utilities
- 5.4.4 Construction and Mining
- 5.4.5 Consumer
- 5.4.6 Logistics and Warehousing
- 5.4.7 Environmental Research and Conservation
- 5.4.8 Media and Entertainment
- 5.4.9 Others
- 5.5 By Geography
- 5.5.1 North America
- 5.5.1.1 United States
- 5.5.1.2 Canada
- 5.5.1.3 Mexico
- 5.5.2 Europe
- 5.5.2.1 Germany
- 5.5.2.2 United Kingdom
- 5.5.2.3 France
- 5.5.2.4 Russia
- 5.5.2.5 Rest of Europe
- 5.5.3 Asia-Pacific
- 5.5.3.1 China
- 5.5.3.2 Japan
- 5.5.3.3 India
- 5.5.3.4 South Korea
- 5.5.3.5 Australia
- 5.5.3.6 Rest of Asia-Pacific
- 5.5.4 South America
- 5.5.4.1 Brazil
- 5.5.4.2 Rest of South America
- 5.5.5 Middle East and Africa
- 5.5.5.1 Middle East
- 5.5.5.1.1 United Arab Emirates
- 5.5.5.1.2 Saudi Arabia
- 5.5.5.1.3 Turkey
- 5.5.5.1.4 Rest of Middle East
- 5.5.5.2 Africa
- 5.5.5.2.1 South Africa
- 5.5.5.2.2 Rest of Africa
- 5.5.5.1 Middle East
- 5.5.1 North America
6 COMPETITIVE LANDSCAPE
- 6.1 Market Concentration
- 6.2 Strategic Moves
- 6.3 Market Share Analysis
- 6.4 Company Profiles (includes Global-level Overview, Market-level Overview, Core Segments, Financials as available, Strategic Information, Market Rank/Share, Products and Services, Recent Developments)
- 6.4.1 Bosch Sensortec GmbH (Robert Bosch GmbH)
- 6.4.2 Sony Semiconductor Solutions Corporation
- 6.4.3 TE Connectivity Corporation
- 6.4.4 InvenSense (TDK Corporation)
- 6.4.5 Ouster, Inc.
- 6.4.6 Trimble Inc.
- 6.4.7 Teledyne Technologies Incorporated
- 6.4.8 Sparton Corporation
- 6.4.9 KVH Industries, Inc.
- 6.4.10 Garmin Ltd.
- 6.4.11 u-blox AG
- 6.4.12 ams-OSRAM AG
- 6.4.13 OMNIVISION
- 6.4.14 LeddarTech Holdings Inc.
- 6.4.15 Infineon Technologies AG
- 6.4.16 Septentrio N.V.
7 MARKET OPPORTUNITIES AND FUTURE OUTLOOK
- 7.1 White-space and Unmet-need Assessment

