
PUBLISHER: Mordor Intelligence | PRODUCT CODE: 2061703

PUBLISHER: Mordor Intelligence | PRODUCT CODE: 2061703
Cell And Gene Therapy Manufacturing Services - Market Share Analysis, Industry Trends & Statistics, Growth Forecasts (2026 - 2031)
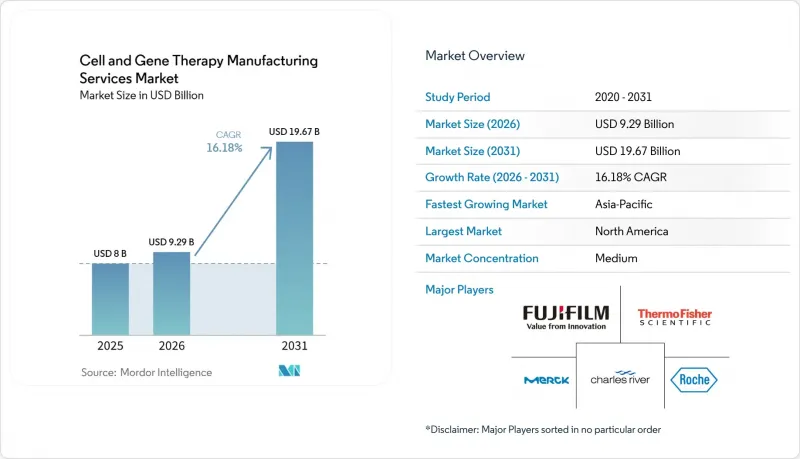
According to Mordor Intelligence, the cell and gene therapy manufacturing services market size is projected to expand from USD 8 billion in 2025 and USD 9.29 billion in 2026 to USD 19.67 billion by 2031, registering a CAGR of 16.18% between 2026 to 2031.
This report is Segmented Into by Service Type (Cell Therapy, Gene Therapy), Phase (Pre-Clinical, Phase I, Phase II, and More), Application (Clinical Manufacturing and Commercial Manufacturing), Indication (Oncology, and More), Mode of Operation (In-House, and More), End User (Pharmaceutical and Biotechnology Companies, and More), and Geography (North America, and More).
Global Cell And Gene Therapy Manufacturing Services Market Trends and Insights
Surge in Prevalence of Cancer and Other Chronic Diseases
Cancer remains the second leading global cause of death, and regulators continue to expedite oncology submissions. The FDA's Oncology Center of Excellence has created rare-tumor review pathways that transform small-population indications into commercially viable segments . A less obvious implication is that CDMOs are launching disease-clustered cleanroom suites so developers can pre-book capacity years in advance, preserving supply for ultra-orphan oncology products even when utilisation hovers below traditional efficiency benchmarks.
Shift Towards Personalized Medicine
Autologous therapies, sourced from each individual patient, require agile facilities capable of running dozens of parallel micro-batches daily. The logistical orchestration around chain-of-identity tracking now rivals the scientific complexity of the drug itself, and many senior operations managers privately concede that digital traceability platforms are becoming the single biggest differentiator when bidding for new client programs. A notable inference here is the emergence of "manufacturing as a data service"; some CDMOs are monetising their proprietary software for sample tracking separately from their capacity, creating a dual-revenue stream and increasing client switching costs irrespective of physical location.
Simultaneously, allogeneic approaches promise scale economies but must confront immunogenicity and efficacy questions, resulting in a bifurcated capital plan where sponsors hedge their bets: they commission small-footprint autologous suites while reserving adjacent shell space for eventual large-scale allogeneic bioreactors. This real-estate arbitrage, essentially paying today for the right to expand tomorrow, is quietly inflating the asset base of many manufacturers and could pressure future return on invested capital if clinical data fail to validate allogeneic pipelines.
High Operational Costs
Manufacturing costs for approved cell and gene therapies routinely exceed USD 1 million per treatment, driven by customised raw materials, extensive quality control testing and low batch volumes. A notable ripple effect is that reimbursement negotiations increasingly reference factory yield data; payers seek assurances that lot failure rates stay within single-digit thresholds to mitigate drug waste. Consequently, operations leaders are piloting closed, automated systems that reduce human manipulation points, thereby improving reproducibility.
Interestingly, large CDMOs are beginning to quantify automation return on investment not merely in direct labour savings but in expanded regulatory capacity; every reduction in manual interventions potentially reduces FDA inspection scope, freeing finite quality-assurance headcount to support more concurrent programs. This reframing elevates automation from a cost-containment initiative to a revenue-expandability lever.
Other drivers and restraints analyzed in the detailed report include:
- Growing Approvals and Robust Clinical Pipelines
- Increasing Investment and Funding
- Scarcity of Skilled Cell-Processing Workforce
For complete list of drivers and restraints, kindly check the Table Of Contents.
Segment Analysis
Cell therapy manufacturing controls approximately 59.30 % of current revenue, yet gene therapy services-anchored on viral vector supply-are expanding at a projected 23.3 % CAGR from 2026 to 2031. CDMOs with vertically integrated plasmid-to-fill capabilities are uniquely positioned to capitalise, as they can compress lead times by eliminating inter-company tech-transfer steps. While non-viral delivery technologies attract investor interest, they remain largely pre-commercial, so vector demand will likely outstrip supply through the end of the decade.
Phase II projects constitute the largest slice of today's workload, but commercial manufacturing is growing fastest, at an estimated 27.6 % CAGR. Late-stage sponsors are discovering that validation protocols designed for monoclonal antibodies do not automatically translate to living therapies. CDMOs that invested early in process analytical technologies are therefore winning contracts, as real-time monitoring meets regulators' expectations for consistent product quality even in patient-specific batches.
Geography Analysis
North America's 44.30% share reflects deep venture markets in 2025, mature regulatory frameworks, and a dense network of specialist CDMOs. The strategic placement of facilities near integrator air hubs in Louisville, Memphis, and Cincinnati shortens autologous vein-to-vein cycles, an operational advantage that now factors into payer reimbursement discussions.
Asia-Pacific's projected 20.80% CAGR is driven by government incentives, workforce investments, and rapid patient adoption. Countries such as South Korea have enacted accelerated approval routes for regenerative treatments, spurring developers to build local capacity. Yet the region must still scale specialized training programs to avoid labor shortages that could erode its cost advantage.
Europe combines stringent but transparent regulation with robust academic networks. Manufacturers here are pioneering real-time release testing pilots, aiming to reduce batch-release timelines and offset higher wage costs. In addition, EU sustainability directives are nudging facilities toward greener single-use systems, a differentiator for sponsors with corporate-social-responsibility mandates.
- Lonza Group
- Catalent
- Thermo Fisher Scientific
- Fujifilm Diosynth Biotechnologies (FUJIFILM Holdings)
- WuXi Advanced Therapies (WuXi AppTec)
- Charles River
- Samsung Biologics (Cell & Gene)
- Merck KGaA (MilliporeSigma)
- Minaris Regenerative Medicine
- Roche
- Oxford Biomedica plc
- National Resilience Inc.
- Andelyn Biosciences
- Nikon CeLL Innovation Co. Ltd.
- Takara Bio
- Genezen
- PlasmidFactory GmbH
- Vivebiotech
- ABL Inc.
Additional Benefits:
- The market estimate (ME) sheet in Excel format
- 3 months of analyst support
TABLE OF CONTENTS
1 Introduction
- 1.1 Study Assumptions & Market Definition
- 1.2 Scope of the Study
2 Research Methodology
3 Executive Summary
4 Market Landscape
- 4.1 Market Overview
- 4.2 Market Drivers
- 4.2.1 Surge in Prevalene of Cancer and Other Chronic Diseases
- 4.2.2 Sift Towards Personalized Medicine
- 4.2.3 Surge in Rare-Disease Designations Driving CGT Pipeline
- 4.2.4 Shift Toward Allogeneic "Off-the-Shelf" Platforms Requiring Large-Scale Bioreactors
- 4.2.5 Growing Approvals and Robust Clinical Pipelines
- 4.2.6 Increasing Investment and Funding
- 4.3 Market Restraints
- 4.3.1 High operational Costs
- 4.3.2 High Autologous CAR-T Batch-Failure Rates (≈15 %) Eroding CDMO Margins
- 4.3.3 Scarcity of Skilled Cell-Processing Workforce
- 4.3.4 Regulatory Harmonization Gaps
- 4.4 Value Chain Analysis
- 4.5 Regulatory & Technological Outlook
- 4.6 Porter's Five Forces Analysis
- 4.6.1 Bargaining Power of Suppliers
- 4.6.2 Bargaining Power of Buyers
- 4.6.3 Threat of New Entrants
- 4.6.4 Threat of Substitutes
- 4.6.5 Intensity of Rivalry
5 Market Size & Growth Forecasts (Value, USD)
- 5.1 By Service Type
- 5.1.1 Cell Therapy Manufacturing Services
- 5.1.1.1 Allogeneic
- 5.1.1.2 Autologous
- 5.1.2 Gene Therapy Manufacturing Services
- 5.1.2.1 Viral Vector
- 5.1.2.1.1 Adeno-Associated Virus (AAV)
- 5.1.2.1.2 Lentivirus
- 5.1.2.1.3 Retrovirus
- 5.1.2.2 Non-Viral Vector
- 5.1.2.2.1 Plasmid DNA
- 5.1.2.2.2 Lipid Nanoparticles (LNP)
- 5.1.2.1 Viral Vector
- 5.1.1 Cell Therapy Manufacturing Services
- 5.2 By Phase
- 5.2.1 Pre-clinical
- 5.2.2 Phase I
- 5.2.3 Phase II
- 5.2.4 Phase III
- 5.2.5 Commercial
- 5.3 By Application
- 5.3.1 Clinical Manufacturing
- 5.3.2 Commercial Manufacturing
- 5.4 By Indication
- 5.4.1 Oncology
- 5.4.2 Rare Diseases
- 5.4.3 Cardiovascular Diseases
- 5.4.4 Orthopedic Diseases
- 5.4.5 Infectious Diseases
- 5.4.6 Other Indications
- 5.5 By Mode of Operation
- 5.5.1 In-house
- 5.5.2 Contract / Outsourced
- 5.6 By End User
- 5.6.1 Pharmaceutical & Biotechnology Companies
- 5.6.2 Academic & Research Institutes
- 5.6.3 Hospital-Based GMP Units
- 5.6.4 Other End Users
- 5.7 By Geography
- 5.7.1 North America
- 5.7.1.1 United States
- 5.7.1.2 Canada
- 5.7.1.3 Mexico
- 5.7.2 Europe
- 5.7.2.1 Germany
- 5.7.2.2 United Kingdom
- 5.7.2.3 France
- 5.7.2.4 Italy
- 5.7.2.5 Spain
- 5.7.2.6 Rest of Europe
- 5.7.3 Asia-Pacific
- 5.7.3.1 China
- 5.7.3.2 Japan
- 5.7.3.3 India
- 5.7.3.4 South Korea
- 5.7.3.5 Australia
- 5.7.3.6 Rest of Asia-Pacific
- 5.7.4 Middle East
- 5.7.4.1 GCC
- 5.7.4.2 South Africa
- 5.7.4.3 Rest of Middle East
- 5.7.5 South America
- 5.7.5.1 Brazil
- 5.7.5.2 Argentina
- 5.7.5.3 Rest of South America
- 5.7.1 North America
6 Competitive Landscape
- 6.1 Market Concentration
- 6.2 Strategic Moves
- 6.3 Market Share Analysis
- 6.4 Company profiles (includes Global level Overview, Market level overview, Core Business Segments, Financials, Headcount, Key Information, Market Rank, Market Share, Products and Services, and analysis of Recent Developments)
- 6.4.1 Lonza Group AG
- 6.4.2 Catalent Inc.
- 6.4.3 Thermo Fisher Scientific Inc.
- 6.4.4 Fujifilm Diosynth Biotechnologies (FUJIFILM Holdings)
- 6.4.5 WuXi Advanced Therapies (WuXi AppTec)
- 6.4.6 Charles River Laboratories
- 6.4.7 Samsung Biologics (Cell & Gene)
- 6.4.8 Merck KGaA (MilliporeSigma)
- 6.4.9 Minaris Regenerative Medicine
- 6.4.10 F. Hoffmann-La Roche Ltd
- 6.4.11 Oxford Biomedica plc
- 6.4.12 National Resilience Inc.
- 6.4.13 Andelyn Biosciences
- 6.4.14 Nikon CeLL Innovation Co. Ltd.
- 6.4.15 Takara Bio Inc.
- 6.4.16 Genezen
- 6.4.17 PlasmidFactory GmbH
- 6.4.18 Vivebiotech
- 6.4.19 ABL Inc.
7 Market Opportunities & Future Outlook
- 7.1 White-space & Unmet-need Assessment

