
PUBLISHER: Mordor Intelligence | PRODUCT CODE: 2061723

PUBLISHER: Mordor Intelligence | PRODUCT CODE: 2061723
Precast Concrete - Market Share Analysis, Industry Trends & Statistics, Growth Forecasts (2026 - 2031)
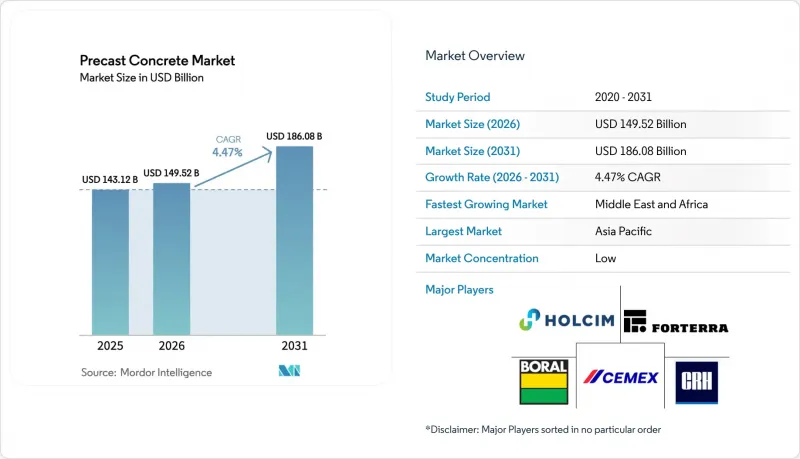
According to Mordor Intelligence, precast concrete market size in 2026 is estimated at USD 149.52 billion, growing from 2025 value of USD 143.12 billion with 2031 projections showing USD 186.08 billion, growing at 4.47% CAGR over 2026-2031.
This report is Segmented by Product Type (Columns and Beams, Walls and Barriers, Floors and Roofs, Pipes, Paving Slabs, Others), End-Use Industry (Residential, Commercial, Infrastructure, Industrial and Institutional), and Geography (Asia-Pacific, North America, Europe, South America, Middle East and Africa). The Market Forecasts are Provided in Terms of Value (USD).
Global Precast Concrete Market Trends and Insights
Government-led Megaproject Pipelines
National infrastructure programs funnel predictable volumes to the precast concrete market by standardizing designs and front-loading component procurement. The USD 1.2 trillion U.S. Infrastructure Investment and Jobs Act, the European Green Deal's low-carbon build targets, and China's mandate that 30% of new urban buildings employ prefabrication collectively underpin a multiyear demand base. Tasmania's Bridgewater Bridge replacement documented a 40% schedule reduction versus cast-in-place options. Scale procurement compresses unit costs and assures cross-project quality consistency. Suppliers with regional hub plants and modular formwork systems capture early-stage package awards, reinforcing first-mover advantages.
Housing-for-All Mandates in Emerging Economies
Affordable-housing blueprints elevate precast adoption by tying subsidy disbursements to rapid, standardized delivery within the precast concrete industry. India's Pradhan Mantri Awas Yojana targets 20 million units and reports 50% faster build cycles plus 15% direct cost savings with precast walls, slabs, and stair cores[2]. Indonesia relocates portable factories across its archipelago, proving that mobile batch plants overcome geographic fragmentation. Predictable volume unlocks investments in automated carousel lines that triple hourly output compared with conventional yards. Latin American social-housing ministries increasingly require factory-molded panels to meet hurricane-load codes, illustrating the alignment between cost, speed, and resilience objectives.
High Logistics Cost of Oversize Elements
Hauling girders longer than 30 meters can add 15-25% to delivered component cost , especially beyond 100 km from the plant[3]. Limited bridge clearances and weight caps force circuitous routes that inflate fuel usage and permit fees. Urban congestion magnifies crane staging and road-closure requirements, compressing allowable delivery windows and raising overtime premiums. Remote project sites endure elevated escort-vehicle expenses, occasionally offsetting factory productivity benefits in the precast concrete industry. Suppliers mitigate exposure by deploying satellite yards or designing splice-ready segments, yet capex for mobile forms and batch setups restrains near-term scalability.
Other drivers and restraints analyzed in the detailed report include:
- Shift to Off-site Manufacturing Amid Skilled-Labor Scarcity
- Embodied-Carbon Credits Monetization
- Competition from Self-Healing In-situ Concretes
For complete list of drivers and restraints, kindly check the Table Of Contents.
Segment Analysis
Columns and beams anchored the precast concrete market size, accounting for 36.62% share in 2025. Robust demand stems from high-rise, bridge, and industrial frameworks where load-bearing precision necessitates controlled factory casting. Walls and barriers are poised to expand at a 5.07% CAGR to 2031 as governments tighten perimeter-security codes and modular housing kits proliferate. Floors and roofs benefit from open-plan preferences, leveraging long-span hollow-core slabs that cut on-site shoring time. Pipe segments track water-infrastructure funding cycles, while paving slabs serve steady streetscape renewal programs.
Automation reshapes all product lines: robotized cages trim labor by 40-60% across the precast concrete industry; laser projection ensures formwork accuracy, and 3D-printed molds facilitate custom architectural textures. Integrated insulation and conduit chases elevate walls and barriers from commodity panels to turnkey envelope systems, supporting premium pricing. Standardized connection hardware accelerates job-site assembly, embedding speed advantages directly into component design. Earthquake zones demand ductile joint details, reinforcing the regional tailoring of product portfolios.
Geography Analysis
Asia-Pacific held a 39.12% share of the precast concrete market in 2025, with China enforcing 30% prefabrication quotas across new urban projects and India subsidizing low-income housing starts. Regional manufacturers capitalize on scale economies and local cement supplies, driving export of standardized formwork technology to Vietnam and the Philippines. Japan and South Korea pioneer seismic-grade precast frames, while Australia integrates high-durability marine mixes for coastal infrastructure.
The Middle East and Africa register the fastest 4.83% CAGR to 2031. Gulf sovereign wealth funds channel capital into smart-city platforms such as Saudi Arabia's NEOM, which specifies factory-finished facades for thermal efficiency. Qatar's World Cup build-out left a legacy of yard capacity now redeployed for metro and desalination projects. African metros like Nairobi and Lagos trial modular schools and hospitals, yet road-haul limits and crane shortages temper immediate scalability.
North America and Europe exhibit mature yet innovation-driven demand profiles within the precast concrete industry. U.S. insurers' resilience discounts spur uptake in hurricane corridors, while Canada's carbon-tax schedule incentivizes low-cement precast mixes. European tender specifications increasingly weight cradle-to-gate CO2 declarations, pushing suppliers to adopt clinker-reduced cements and renewable-energy curing kilns. Market access hinges on meeting evolving EN and ASTM standards alongside locally calibrated environmental product declarations.
- Balfour Beatty
- Boral Ltd.
- Bouygues Construction
- CEMEX S.A.B. de C.V.
- CRH
- ELO Beton
- Forterra Building Products Limited
- FP McCann
- Gulf Precast
- Holcim
- Larsen & Toubro Limited
- Molins
- Oldcastle Infrastructure Inc.
- Skanska
- The Wells Companies, Inc.
- Tindall Corporation
Additional Benefits:
- The market estimate (ME) sheet in Excel format
- 3 months of analyst support
TABLE OF CONTENTS
1 Introduction
- 1.1 Study Assumptions and Market Definition
- 1.2 Scope of the Study
2 Research Methodology
3 Executive Summary
4 Market Landscape
- 4.1 Market Overview
- 4.2 Market Drivers
- 4.2.1 Government-led megaproject pipelines
- 4.2.2 Housing-for-All mandates in emerging economies
- 4.2.3 Shift to off-site manufacturing amid skilled-labor scarcity
- 4.2.4 Embodied-carbon credits monetisation
- 4.2.5 Insurance-premium discounts for resilient precast structures
- 4.3 Market Restraints
- 4.3.1 High logistics cost of oversize elements
- 4.3.2 Competition from self-healing in-situ concretes
- 4.3.3 Regional code fragmentation
- 4.4 Value Chain Analysis
- 4.5 Porter's Five Forces
- 4.5.1 Bargaining Power of Suppliers
- 4.5.2 Bargaining Power of Buyers
- 4.5.3 Threat of New Entrants
- 4.5.4 Threat of Substitutes
- 4.5.5 Degree of Competition
5 Market Size and Growth Forecasts (Value)
- 5.1 By Product Type
- 5.1.1 Columns and Beams
- 5.1.2 Walls and Barriers
- 5.1.3 Floors and Roofs
- 5.1.4 Pipes
- 5.1.5 Paving Slabs
- 5.1.6 Others
- 5.2 By End-use Industry
- 5.2.1 Residential
- 5.2.2 Commercial
- 5.2.3 Infrastructure
- 5.2.4 Industrial and Institutional
- 5.3 By Geography
- 5.3.1 Asia-Pacific
- 5.3.1.1 China
- 5.3.1.2 India
- 5.3.1.3 Japan
- 5.3.1.4 South Korea
- 5.3.1.5 Malaysia
- 5.3.1.6 Thailand
- 5.3.1.7 Indonesia
- 5.3.1.8 Vietnam
- 5.3.1.9 Rest of Asia-Pacific
- 5.3.2 North America
- 5.3.2.1 United States
- 5.3.2.2 Canada
- 5.3.2.3 Mexico
- 5.3.3 Europe
- 5.3.3.1 Germany
- 5.3.3.2 United Kingdom
- 5.3.3.3 Italy
- 5.3.3.4 France
- 5.3.3.5 Russia
- 5.3.3.6 Spain
- 5.3.3.7 Turkey
- 5.3.3.8 Nordic Countries
- 5.3.3.9 Rest of Europe
- 5.3.4 South America
- 5.3.4.1 Brazil
- 5.3.4.2 Argentina
- 5.3.4.3 Colombia
- 5.3.4.4 Rest of South America
- 5.3.5 Middle East and Africa
- 5.3.5.1 Saudi Arabia
- 5.3.5.2 United Arab Emirates
- 5.3.5.3 Qatar
- 5.3.5.4 Egypt
- 5.3.5.5 Nigeria
- 5.3.5.6 South Africa
- 5.3.5.7 Rest of Middle East and Africa
- 5.3.1 Asia-Pacific
6 Competitive Landscape
- 6.1 Market Concentration
- 6.2 Strategic Moves
- 6.3 Market Share (%)**/Ranking Analysis
- 6.4 Company Profiles (includes Global level Overview, Market level overview, Core Segments, Financials as available, Strategic Information, Market Rank/Share for key companies, Products and Services, and Recent Developments)
- 6.4.1 Balfour Beatty
- 6.4.2 Boral Ltd.
- 6.4.3 Bouygues Construction
- 6.4.4 CEMEX S.A.B. de C.V.
- 6.4.5 CRH
- 6.4.6 ELO Beton
- 6.4.7 Forterra Building Products Limited
- 6.4.8 FP McCann
- 6.4.9 Gulf Precast
- 6.4.10 Holcim
- 6.4.11 Larsen & Toubro Limited
- 6.4.12 Molins
- 6.4.13 Oldcastle Infrastructure Inc.
- 6.4.14 Skanska
- 6.4.15 The Wells Companies, Inc.
- 6.4.16 Tindall Corporation
7 Market Opportunities and Future Outlook
- 7.1 White-space and Unmet-need Assessment

