
PUBLISHER: Mordor Intelligence | PRODUCT CODE: 2061738

PUBLISHER: Mordor Intelligence | PRODUCT CODE: 2061738
Quick-Service Restaurant (QSR) - Market Share Analysis, Industry Trends & Statistics, Growth Forecasts (2026 - 2031)
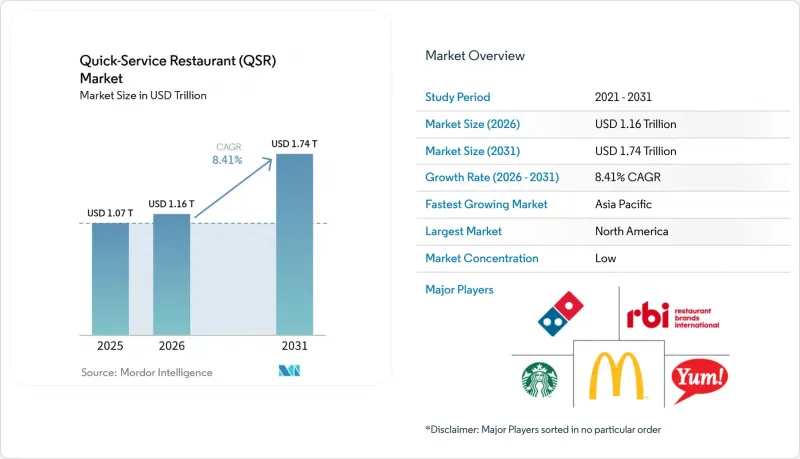
According to Mordor Intelligence, the quick-service restaurant (QSR) market was valued at USD 1.07 billion in 2025 and is estimated to grow from USD 1.16 billion in 2026 to USD 1.74 billion by 2031, at a CAGR of 8.41% during the forecast period (2026-2031).
This report is Segmented by Cuisine (Burger/Sandwich, Pizza/Pasta, Meat-Based Cuisine, and More), by Structure (Independent Outlets and Chained/Franchised Outlets), by Service Model (Dine-In, Drive-Thru, Tae-Away/Walk-up Counter, and More), and by Geography (North America, Europe, Asia-Pacific, South America, and Middle East and Africa). The Market Forecasts are Provided in Terms of Value (USD).
Global Quick-Service Restaurant (QSR) Market Trends and Insights
Expansion of drive-thru and off-premise channels
Drive-thru lanes and off-premise formats are transforming store economics by enabling operators to increase revenue per square foot without expanding dining areas. In 2025, McDonald's reported that 70% of its U.S. sales came from drive-thru and delivery channels. New locations dedicated just 25% of their floor space to seating while investing in dual-lane drive-thrus equipped with AI-powered voice ordering, which cut transaction times to under 90 seconds. Chains in Australia and the Middle East are retrofitting existing sites with walk-up windows and dedicated curbside pickup bays, achieving an 18% increase in throughput in pilot markets during 2025. This shift also eases labor pressures, as off-premise orders require fewer front-of-house staff and allow kitchens to batch production during peak periods. Regulatory requirements in the U.S. and Canada add USD 50,000-100,000 per site to ensure Americans with Disabilities Act (ADA)-compliant drive-thru accessibility, balancing upfront costs with legal compliance and operational efficiency, according to the U.S. Department of Justice.
Rapid urbanization and busy lifestyle accelerating quick-service restaurants
Rapid urbanization and increasingly busy lifestyles are driving the growth of quick-service restaurants (QSRs) globally. As urban populations grow and consumer routines become more fast-paced, demand for quick, convenient dining options has surged, creating significant opportunities for QSR chains to expand their footprints. As of 2024, McDonald's operates a total of 43,477 outlets worldwide , showcasing its extensive global reach and dominance in the fast-food market. The brand continues to expand its presence, catering to diverse consumer preferences across various regions. Similarly, KFC, with 31,981 stores globally as of 2024, has established itself as a significant player in the fast-food industry . Known for its fried chicken offerings, KFC's widespread presence highlights its ability to adapt to different markets and sustain its growth trajectory. The increasing penetration and expansion of QSR chains like McDonald's and KFC underline the sector's ability to meet the evolving demands of urban consumers seeking convenience and quick meal options. This trend is further supported by QSR brands' strategic efforts to innovate their menus, enhance delivery services, and leverage digital platforms to reach a broader audience, thereby ensuring sustained growth in the competitive fast-food market.
Rising competition from fast-casual and food delivery services
Fast-casual chains such as Chipotle, Panera, and Shake Shack are capturing share from traditional QSR operators by positioning at a 20% to 30% price premium while emphasizing fresh ingredients, customizable menus, and transparent sourcing. Chipotle's U.S. same-store sales grew 11% in 2025, outpacing the QSR sector's average of 6%, as the brand attracted health-conscious consumers willing to pay between USD 12 and USD 15 per entree for perceived quality. Ghost kitchens and virtual brands, delivery-only concepts operating from shared commissaries, are proliferating in urban cores, offering 40% lower overhead than traditional storefronts and enabling rapid menu experimentation. These entrants compress incumbents' pricing power and force legacy brands to invest in menu innovation and digital capabilities, diverting capital from unit expansion and pressuring return on invested capital in mature markets.
Other drivers and restraints analyzed in the detailed report include:
- Digital loyalty and subscription programs boosting repeat visits
- Rising tourism and out-of-home dining
- Rising obesity and chronic diseases
For complete list of drivers and restraints, kindly check the Table Of Contents.
Segment Analysis
Pizza and pasta concepts are experiencing the fastest growth among QSR cuisine segments, expanding at a 10.26% CAGR through 2031. Operators are leveraging conveyor ovens and AI-driven baking algorithms to reduce production times from 12 minutes to 7 minutes, enabling scalable ghost-kitchen models in dense urban areas, as highlighted by Domino's Pizza Inc. Meat-based offerings, including burgers, fried chicken, and sandwiches, accounted for 37.18% of the market in 2025, led by McDonald's, KFC, and Burger King, but growth is moderating to 7.8% CAGR. This slowdown reflects shifting consumer preferences toward plant-based proteins and heightened regulatory scrutiny over processed meats in Europe and North America, according to the World Health Organization. Seafood and dessert/ice cream concepts remain niche, contributing less than 10% of revenue, yet premium positioning and seasonal demand sustain modest mid-single-digit growth.
Other cuisines, including Mexican, Asian, and Mediterranean, are steadily gaining share as operators experiment with fusion formats and limited-time offerings to test consumer interest without committing to permanent menu changes. Taco Bell's U.S. same-store sales grew 9% in 2025, supported by value-oriented Cravings Boxes and celebrity-chef collaborations that drove social-media engagement, per Yum! Brands Inc. Asian-inspired bowls and noodle concepts are spreading across North America and Europe, appealing to younger, customization-focused demographics, though supply-chain complexity and higher ingredient costs limit scalability relative to burgers and pizza. Cuisine strategies are increasingly converging toward hybrid formats, offering burgers, chicken, salads, and sides under one roof, to maximize kitchen efficiency and serve mixed-party groups, a model that Wendy's and Shake Shack are piloting in select markets.
Geography Analysis
North America remains the largest QSR market globally, accounting for 32.69% of revenue in 2025. The region benefits from a mature drive-thru infrastructure, high per-capita spending on convenience meals (approximately USD 1,200 annually), and smartphone penetration exceeding 85%, which supports digital ordering and loyalty programs. The U.S. dominates with over 200,000 QSR outlets and same-store sales growth of 6% in 2025, driven by menu innovation, value offerings, and automation investments that offset labor-cost inflation. Canada's market is expanding at a 7.2% CAGR, fueled by population growth and Tim Hortons' dominance in coffee and breakfast segments, while Mexico is growing at 8.5% annually due to rising middle-class incomes and urbanization in secondary cities. Regulatory factors, such as California's Fast Food Council and mandated minimum wages of USD 20, are accelerating the adoption of automation and prompting experimentation with labor-light formats, including digital kiosks and ghost kitchens.
The Asia-Pacific region is the fastest-growing, expanding at a 10.49% CAGR through 2031, driven by rising disposable incomes, widespread smartphone penetration (over 80%), and low-cost delivery in tier-2 cities. China grew 12% in 2025, led by KFC's extensive network and local brands like Luckin Coffee, which blend Western formats with regional flavors and aggressive digital marketing. India's QSR sector is accelerating at 14% annually, powered by Jubilant FoodWorks' Domino's franchise and Jollibee's expansion into tier-2 cities, where lower real estate costs attract first-time customers. Japan and South Korea remain mature markets, growing 5-6%, with operators investing in automation and delivery partnerships to overcome labor shortages and capture off-peak demand. Australia and Indonesia are expanding 8-9%, driven by tourism recovery and franchise growth in suburban and regional areas.
Europe, South America, and the Middle East and Africa exhibit varied growth dynamics. Europe is growing at 7.3% CAGR, constrained by labor regulations and a preference for sit-down dining, though urbanization and tourism recovery are boosting demand. Germany, the U.K., France, Italy, and Spain generate 60% of European QSR revenue, with menu localization strategies such as beer at McDonald's Germany and halloumi burgers at Burger King UK. Poland, the Netherlands, Belgium, and Sweden are emerging markets with growth exceeding 9% CAGR, aided by smartphone adoption and digital ordering. South America is expanding at 8.2% CAGR, with Brazil and Colombia leading through franchising and delivery-platform penetration, while Argentina's volatility limits growth. MEA is growing at 9.8% CAGR, driven by visa liberalization, mega-events, halal-certified menus, and rising middle-class adoption of digital ordering; UAE and Saudi Arabia lead, while Nigeria, Egypt, Morocco, and Turkey represent high-potential markets with CAGR exceeding 11%, shaping franchise models and partnerships with local operators.
- McDonald's Corporation
- Yum! Brands Inc. (KFC, Taco Bell, Pizza Hut)
- Restaurant Brands International (Burger King, Popeyes, Tim Hortons)
- Domino's Pizza Inc.
- Starbucks Corporation
- The Wendy's Company
- Doctor's Associates Inc (Subway)
- Chick-fil-A Inc.
- Chipotle Mexican Grill Inc.
- Deep Blue Restaurants
- Panera Bread Company
- Papa John's International Inc.
- Shake Shack Inc.
- Jack in the Box Inc.
- Inspire Brands, Inc.
- Jollibee Foods Corporation
- Jubilant FoodWorks Ltd (Domino's India)
- Yoshinoya Holdings Co. Ltd.
- Little Caesars Enterprises Inc.
- Five Guys Enterprises, LLC
Additional Benefits:
- The market estimate (ME) sheet in Excel format
- 3 months of analyst support
TABLE OF CONTENTS
1 INTRODUCTION
- 1.1 Study Assumptions and Market Definition
- 1.2 Scope of the Study
2 RESEARCH METHODOLOGY
3 EXECUTIVE SUMMARY
4 MARKET LANDSCAPE
- 4.1 Market Overview
- 4.2 Market Drivers
- 4.2.1 Expansion of drive-thru and off-premise channels
- 4.2.2 Rapid urbanization and busy lifestyle accelerating quick-service restaurants
- 4.2.3 Digital loyalty and subscription programs boosting repeat visits
- 4.2.4 Expansion of delivery and digital ordering
- 4.2.5 Tech integration and automation
- 4.2.6 Rising tourism and out-of-home dining
- 4.3 Market Restraints
- 4.3.1 Rising competition from fast-casual and food delivery services
- 4.3.2 Labor-cost inflation in high-wage markets compressing margins
- 4.3.3 Rising obesity and chronic diseases
- 4.3.4 Intense market competition
- 4.4 Menu Analysis
- 4.5 Regulatory Outlook
- 4.6 Porter's Five Forces
- 4.6.1 Threat of New Entrants
- 4.6.2 Bargaining Power of Buyers/Consumers
- 4.6.3 Bargaining Power of Suppliers
- 4.6.4 Threat of Substitutes
- 4.6.5 Intensity of Competitive Rivalry
5 MARKET SIZE AND GROWTH FORECASTS (VALUE)
- 5.1 By Cuisine
- 5.1.1 Burger/Sandwich
- 5.1.2 Pizza/Pasta
- 5.1.3 Meat-based Cuisine
- 5.1.4 Seafood
- 5.1.5 Ice-Cream/Dessert
- 5.1.6 Bakery Products
- 5.1.7 Other Cuisines (Mexican, Asian, etc.)
- 5.2 By Structure
- 5.2.1 Independent Outlets
- 5.2.2 Chained/Franchised Outlets
- 5.3 By Service Model
- 5.3.1 Dine-In
- 5.3.2 Drive-Thru
- 5.3.3 Take-Away/Walk-Up Counter
- 5.3.4 Home Delivery (First- and Third-Party)
- 5.3.5 Curbside Pickup
- 5.4 By Geography
- 5.4.1 North America
- 5.4.1.1 United States
- 5.4.1.2 Canada
- 5.4.1.3 Mexico
- 5.4.1.4 Rest of North America
- 5.4.2 Europe
- 5.4.2.1 Germany
- 5.4.2.2 United Kingdom
- 5.4.2.3 Italy
- 5.4.2.4 France
- 5.4.2.5 Spain
- 5.4.2.6 Netherlands
- 5.4.2.7 Poland
- 5.4.2.8 Belgium
- 5.4.2.9 Sweden
- 5.4.2.10 Rest of Europe
- 5.4.3 Asia-Pacific
- 5.4.3.1 China
- 5.4.3.2 India
- 5.4.3.3 Japan
- 5.4.3.4 Australia
- 5.4.3.5 Indonesia
- 5.4.3.6 South Korea
- 5.4.3.7 Thailand
- 5.4.3.8 Singapore
- 5.4.3.9 Rest of Asia-Pacific
- 5.4.4 South America
- 5.4.4.1 Brazil
- 5.4.4.2 Argentina
- 5.4.4.3 Colombia
- 5.4.4.4 Chile
- 5.4.4.5 Peru
- 5.4.4.6 Rest of South America
- 5.4.5 Middle East and Africa
- 5.4.5.1 South Africa
- 5.4.5.2 Saudi Arabia
- 5.4.5.3 United Arab Emirates
- 5.4.5.4 Nigeria
- 5.4.5.5 Egypt
- 5.4.5.6 Morocco
- 5.4.5.7 Turkey
- 5.4.5.8 Rest of Middle East and Africa
- 5.4.1 North America
6 COMPETITIVE LANDSCAPE
- 6.1 Market Concentration
- 6.2 Strategic Moves (Mergers and Acquisitions, Franchising, Tech Investments)
- 6.3 Market Share Analysis
- 6.4 Company Profiles (includes Global level Overview, Market level overview, Core Segments, Financials as available, Strategic Information, Market Rank/Share for key companies, Products and Services, and Recent Developments)
- 6.4.1 McDonald's Corporation
- 6.4.2 Yum! Brands Inc. (KFC, Taco Bell, Pizza Hut)
- 6.4.3 Restaurant Brands International (Burger King, Popeyes, Tim Hortons)
- 6.4.4 Domino's Pizza Inc.
- 6.4.5 Starbucks Corporation
- 6.4.6 The Wendy's Company
- 6.4.7 Doctor's Associates Inc (Subway)
- 6.4.8 Chick-fil-A Inc.
- 6.4.9 Chipotle Mexican Grill Inc.
- 6.4.10 Deep Blue Restaurants
- 6.4.11 Panera Bread Company
- 6.4.12 Papa John's International Inc.
- 6.4.13 Shake Shack Inc.
- 6.4.14 Jack in the Box Inc.
- 6.4.15 Inspire Brands, Inc.
- 6.4.16 Jollibee Foods Corporation
- 6.4.17 Jubilant FoodWorks Ltd (Domino's India)
- 6.4.18 Yoshinoya Holdings Co. Ltd.
- 6.4.19 Little Caesars Enterprises Inc.
- 6.4.20 Five Guys Enterprises, LLC
7 MARKET OPPORTUNITIES AND FUTURE OUTLOOK

