
PUBLISHER: Mordor Intelligence | PRODUCT CODE: 2061900

PUBLISHER: Mordor Intelligence | PRODUCT CODE: 2061900
Copper Clad Laminate - Market Share Analysis, Industry Trends & Statistics, Growth Forecasts (2026 - 2031)
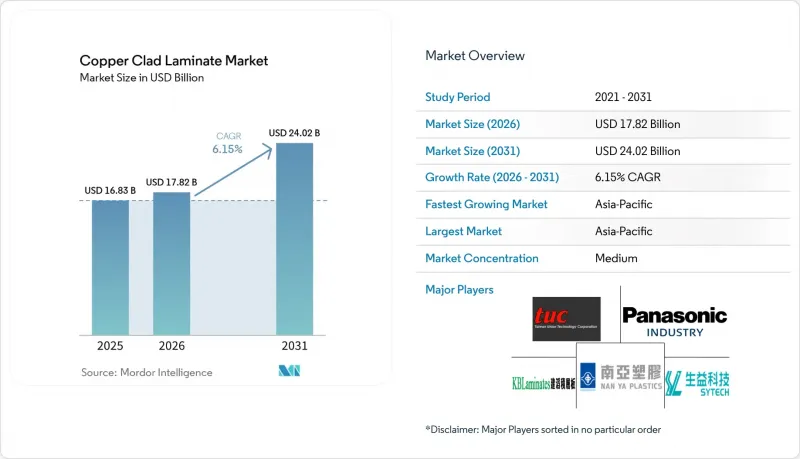
According to Mordor Intelligence, the copper clad laminate market size was valued at USD 16.83 billion in 2025 and is estimated to grow from USD 17.82 billion in 2026 to reach USD 24.02 billion by 2031, at a CAGR of 6.15% during the forecast period (2026-2031).
This report is Segmented by Resin Type (Epoxy, Phenolic, Polyimide, and More), Form Type (Rigid and Flexible), Reinforcement Material (Fiberglass Fabric, Paper-Based, and More), Application (Consumer Electronics, Communication Systems, and More), and Geography (Asia-Pacific, North America, Europe, South America, and Middle East and Africa). The Market Forecasts are Provided in Terms of Value (USD).
Global Copper Clad Laminate Market Trends and Insights
Robust Demand for Electronics and PCB Drives Baseline Growth
India's electronics output climbed from INR 1.90 lakh crore (USD 29.6 billion) in FY 2015 to INR 9.52 lakh crore (USD 113 billion) in FY 2024, raising local PCB requirements and boosting the Copper Clad Laminate market. Twenty-two projects cleared under the Electronics Component Manufacturing Scheme in January 2026 unlocked INR 41,863 crore (USD 4.438 billion) of investment aimed at domestic laminate and PCB (Printed Circuit Board) plants. Suppliers integrating into high-layer HDI (High-Density Interconnect) boards capture stronger margins even as low-cost FR-4 faces price pressure.
Acceleration of 5G Network Infrastructure Rollout Fuels High-Frequency CCL Adoption
5G base-station builds require laminates with dielectric loss below 0.005 across 24-77 GHz, a niche addressed by RO3003 and RO4830 Plus families. Taiwan Union Technology's R&D for halogen-free, carbon-neutral materials underscores how carriers seek both performance and sustainability. Early 6G research is already prompting prototypes of polyimide films operating in the sub-THz band, though readiness sits at TRL 3-6.
Copper and Petroleum-Based Resin Price Volatility Compresses Margins
Copper prices on the London Metal Exchange peaked near USD 13,842 per tonne in 2024 before moderating, and epoxy resin feedstock costs rose 7-10% annually through 2025, driven by petroleum price swings and supply-chain disruptions in Asia-Pacific. Resonac Holdings implemented a 30% price increase effective March 2026, and Kingboard Laminates and Nan Ya Plastics executed multiple price adjustments in 2025, yet these actions lag raw-material cost spikes by 3-6 months, compressing gross margins during the interim. Smaller CCL manufacturers without vertical integration into copper foil or resin production face acute vulnerability: they lack the scale to negotiate fixed-price contracts and cannot absorb cost inflation without passing it downstream, which risks losing share to larger competitors who can offer price stability.
Other drivers and restraints analyzed in the detailed report include:
- Automotive Electrification and ADAS Penetration Reshape Material Specifications
- AI-Server Boards Demand Ultra-Thin Embedded-Capacitance CCL
- Stricter Global EHS and Carbon-Footprint Regulations Elevate Compliance Costs
For complete list of drivers and restraints, kindly check the Table Of Contents.
Segment Analysis
Epoxy held 65.66% of 2025 volume, anchoring commodity boards for consumer devices, yet polyimide captured faster growth with a 7.12% CAGR through 2031 as aerospace and flexible electronics seek durability to 250°C. Specialty fluoropolymer grades, though small, earn 3-5 times epoxy prices by meeting mmWave and radar requirements. Suppliers such as Shengyi integrate PTFE capability to secure embedded-capacitance server wins, highlighting how resin choice determines margin bands.
High-performance blends now pair epoxy with PPO to reduce CTE mismatch, supporting multi-layer server boards. Phenolic and paper-based products are declining as single-sided applications fade. Composite resin launches, including Arlon's 85N and Panasonic's HIPER series, capture aerospace and EV inverter niches and help suppliers defend pricing power during raw-material swings.
Rigid products contributed 78.21% of 2025 revenue, yet flexible laminates are pacing at a 7.34% CAGR to 2031, owing to foldable phones and wearables. Doosan's FCCL demonstrates durability over 1 million folds, while Taiflex's USD 35 million Thailand plant will support automotive interiors and display modules.
Rigid-flex hybrids are spreading into medical devices and robotics, commanding a 2-3 times cost premium. Suppliers that master ultra-thin copper handling and adhesive-less lamination secure design-win stickiness. Meanwhile, large rigid producers defend scale economies through in-house glass fabric and copper foil, allowing aggressive pricing in commodity FR-4 to protect share.
Geography Analysis
Asia-Pacific generated 35.38% of 2025 revenue and is projected to rise at a 7.78% CAGR through 2031. Thailand and India alone have announced incentive-led investments, catalyzing local laminate demand. China maintains the largest consumption base, yet geopolitical shifts are steering Taiwanese and mainland firms to Southeast Asia, with Thailand's PCB share expected to top 5% globally in 2026.
North America and Europe together accounted for about half of global revenue, owing to aerospace, defense, and hyperscale data centers. AGC Multi Material America expanded distribution through Tritek to fortify UnitedStates supply security. EU carbon policies elevate compliance hurdles, favoring large incumbents that can fund halogen-free and renewable power upgrades.
South America and the Middle East & Africa held the lowest share in 2025. Brazil's vehicle rebound and Gulf-state telecom projects offer white-space growth, but infrastructure gaps and limited upstream feedstocks temper near-term penetration. Early movers that provide local technical support may capture loyalty as regional manufacturing ecosystems mature.
- AGC Inc.
- Chang Chun Group
- Doosan Corporation Electro-Materials
- Elite Material Co., Ltd.
- Goldenmax International Technology Ltd.
- Grace Electron
- Guangdong Chaohua Technology Co., Ltd.
- Isola Group
- ITEQ CORPORATION
- Kingboard Laminates Holdings Ltd.
- NAN YA PLASTICS CORPORATION
- Panasonic Industry Co., Ltd.
- Resonac Holdings Corporation
- Rogers Corporation
- Shandong Jinbao Electronics Co., Ltd.
- SHENGYI TECHNOLOGY CO., LTD.
- Sumitomo Bakelite Co., Ltd.
- Sytech Technology Co., Ltd.
- TACONIC
- Taiwan Union Technology Corporation
- Ventec International Group
- ZHEJIANG WAZAM NEW MATERIALS CO., LTD.
Additional Benefits:
- The market estimate (ME) sheet in Excel format
- 3 months of analyst support
TABLE OF CONTENTS
1 Introduction
- 1.1 Study Assumptions and Market Definition
- 1.2 Scope of the Study
2 Research Methodology
3 Executive Summary
4 Market Landscape
- 4.1 Market Overview
- 4.2 Market Drivers
- 4.2.1 Robust demand for electronics and PCB
- 4.2.2 Acceleration of 5G network infrastructure rollout
- 4.2.3 Automotive electrification and ADAS penetration
- 4.2.4 AI-server boards need ultra-thin embedded-capacitance CCL
- 4.2.5 Rise of GaN/SiC power modules needing high-thermal CCL
- 4.3 Market Restraints
- 4.3.1 Copper and petroleum-based resin price volatility
- 4.3.2 Stricter global EHS and carbon-footprint regulations
- 4.3.3 CAPEX inflation for next-gen press and plasma lines
- 4.4 Value Chain Analysis
- 4.5 Porter's Five Forces
- 4.5.1 Bargaining Power of Suppliers
- 4.5.2 Bargaining Power of Buyers
- 4.5.3 Threat of New Entrants
- 4.5.4 Threat of Substitutes
- 4.5.5 Competitive Rivalry
5 Market Size and Growth Forecasts (Value)
- 5.1 By Resin Type
- 5.1.1 Epoxy
- 5.1.2 Phenolic
- 5.1.3 Polyimide
- 5.1.4 Polyester
- 5.1.5 Fluoropolymer / PTFE
- 5.1.6 Polyphenylene Ether (PPE)
- 5.1.7 Polyphenylene Oxide (PPO)
- 5.1.8 Others
- 5.2 By Form Type
- 5.2.1 Rigid
- 5.2.2 Flexible
- 5.3 By Reinforcement Material
- 5.3.1 Fiberglass Fabric
- 5.3.2 Paper-based
- 5.3.3 Composite / Aramid / LCP
- 5.3.4 Other Materials
- 5.4 By Application
- 5.4.1 Communication Systems
- 5.4.2 Consumer Electronics
- 5.4.3 Automotive Electronics and EV Powertrain
- 5.4.4 Industrial and Power Electronics
- 5.4.5 Data-centre and AI Servers
- 5.4.6 Aerospace and Defense
- 5.4.7 Other Applications
- 5.5 By Geography
- 5.5.1 Asia-Pacific
- 5.5.1.1 China
- 5.5.1.2 India
- 5.5.1.3 Japan
- 5.5.1.4 South Korea
- 5.5.1.5 Rest of Asia-Pacific
- 5.5.2 North America
- 5.5.2.1 United States
- 5.5.2.2 Canada
- 5.5.2.3 Mexico
- 5.5.3 Europe
- 5.5.3.1 Germany
- 5.5.3.2 United Kingdom
- 5.5.3.3 France
- 5.5.3.4 Italy
- 5.5.3.5 Rest of Europe
- 5.5.4 South America
- 5.5.4.1 Brazil
- 5.5.4.2 Argentina
- 5.5.4.3 Rest of South America
- 5.5.5 Middle East and Africa
- 5.5.5.1 Saudi Arabia
- 5.5.5.2 South Africa
- 5.5.5.3 Rest of Middle East and Africa
- 5.5.1 Asia-Pacific
6 Competitive Landscape
- 6.1 Market Concentration
- 6.2 Key Strategic Moves
- 6.3 Market Share (%)/Ranking Analysis
- 6.4 Company Profiles (includes Global level Overview, Market level overview, Core Segments, Financials as available, Strategic Information, Products and Services, and Recent Developments)
- 6.4.1 AGC Inc.
- 6.4.2 Chang Chun Group
- 6.4.3 Doosan Corporation Electro-Materials
- 6.4.4 Elite Material Co., Ltd.
- 6.4.5 Goldenmax International Technology Ltd.
- 6.4.6 Grace Electron
- 6.4.7 Guangdong Chaohua Technology Co., Ltd.
- 6.4.8 Isola Group
- 6.4.9 ITEQ CORPORATION
- 6.4.10 Kingboard Laminates Holdings Ltd.
- 6.4.11 NAN YA PLASTICS CORPORATION
- 6.4.12 Panasonic Industry Co., Ltd.
- 6.4.13 Resonac Holdings Corporation
- 6.4.14 Rogers Corporation
- 6.4.15 Shandong Jinbao Electronics Co., Ltd.
- 6.4.16 SHENGYI TECHNOLOGY CO., LTD.
- 6.4.17 Sumitomo Bakelite Co., Ltd.
- 6.4.18 Sytech Technology Co., Ltd.
- 6.4.19 TACONIC
- 6.4.20 Taiwan Union Technology Corporation
- 6.4.21 Ventec International Group
- 6.4.22 ZHEJIANG WAZAM NEW MATERIALS CO., LTD.
7 Market Opportunities and Future Outlook
- 7.1 White-space and Unmet-need Assessment
- 7.2 High-frequency (mmWave), 5G and Automotive Growth Nodes
- 7.3 Capacity Expansion in Emerging Manufacturing Hubs

