
PUBLISHER: Mordor Intelligence | PRODUCT CODE: 2062008

PUBLISHER: Mordor Intelligence | PRODUCT CODE: 2062008
Flocculant And Coagulant - Market Share Analysis, Industry Trends & Statistics, Growth Forecasts (2026 - 2031)
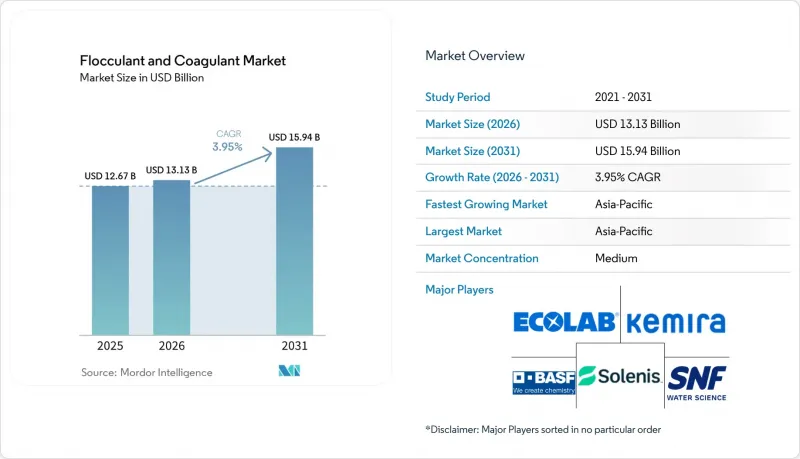
According to Mordor Intelligence, the flocculant and coagulant market size is expected to increase from USD 12.67 billion in 2025 to USD 13.13 billion in 2026 and reach USD 15.94 billion by 2031, growing at a CAGR of 3.95% over 2026-2031.
This report is Segmented by Type (Coagulants: Inorganic, Organic/Synthetic, Natural/Bio-based; Flocculants: Cationic, Anionic, Non-Ionic), Application (Municipal Water Treatment, Industrial Wastewater Treatment: Pulp and Paper, Oil and Gas, and More), and Geography (Asia-Pacific, North America, Europe, South America, Middle-East and Africa). Market Forecasts are Provided in Terms of Value (USD).
Global Flocculant And Coagulant Market Trends and Insights
Stricter Discharge Norms for Emerging-Market Industrial Clusters
In Southeast and South Asia, new regulations compel factories to significantly boost their chemical throughput to comply with stricter limits on Chemical Oxygen Demand (COD) and suspended solids. Starting January 2025, Vietnam's QCVN 40:2025 regulation reduced COD allowances for effluents from textile and food-processing industries to 50 mg/L. Meanwhile, Indonesia's 2024 rule on domestic wastewater mandates an 80% removal of solids, leading to necessary upgrades in municipalities like Jakarta, Surabaya, and Bandung. Turkey, South Korea, and India have also tightened regulations, shortening procurement windows, favoring suppliers with local stock, and creating demand spikes that exceed the headline CAGR in these regions.
Rapid Build-Out of Zero-Liquid-Discharge (ZLD) Power and Petrochem Plants
Zero Liquid Discharge (ZLD) systems utilize coagulation, reverse osmosis, and crystallization techniques to achieve near-total water recovery. Coagulants are embedded as a mandatory pretreatment step to safeguard the membranes. Veolia has implemented a system at Shell's Pearl GTL plant, successfully treating 12,000 m3/day of blowdown with a 99.5% recovery rate. China's coal-chemical initiatives in Shaanxi and Inner Mongolia, along with textile clusters in India in 2025, are aimed at zero discharge. This urgency is steering them towards long-term chemical service contracts, often at a premium price.
Regulatory Toxicity Spotlight on Acrylamide Monomer Residues
In 2024, the U.S. EPA added acrylamide to its Contaminant Candidate List. WHO set a cap of 0.5 mg/kg for residual acrylamide in drinking water and Japan reduced food-contact limits to 0.05 mg/kg. The EU plans to restrict formulations with over 0.1 percent residual monomer. Producers face purification costs of USD 0.10 to 0.30 per kg. Offering certified low-residue grades may assist producers in maintaining a competitive position within the market.
Other drivers and restraints analyzed in the detailed report include:
- Re-Use Mandates in Water-Scarce Regions
- Mature Utility Spending Cycles in North America and Europe
- Growing Preference for Membrane and Electro-Coagulation Hybrids
For complete list of drivers and restraints, kindly check the Table Of Contents.
Segment Analysis
In 2025, coagulants captured a 57.89% share of the revenue pie, and projections indicate this segment will grow at a 4.56% CAGR through 2031. Within the coagulant segment, inorganic variants like PAC, aluminum sulfate, and ferric chloride lead in tonnage. This dominance is supported by China's 2025 output of 2.3123 million tons of PAC, fetching an average domestic price of CNY 1,636/ton (approximately USD 230/ton). Organic coagulants, such as polyDADMAC and EPI-DMDA, have a price premium of 15-30%. These organic variants perform well in high-alkalinity waters, where their ability to reduce sludge volume justifies the elevated costs. Bio-based alternatives like chitosan and Moringa extracts have shown 85-95% turbidity removal in lab tests. However, challenges in the supply chain and consistency have limited their market share.
Flocculants play a critical role in sludge dewatering and mineral processing. Cationic polyacrylamides account for the majority of flocculant revenue, driven by the need for high-charge polymers in municipal sludge and mining tailings to facilitate water release. Anionic variants are used as retention aids in the pulp-and-paper industry, while non-ionic grades are applied in coal washing. Regulatory initiatives aiming to limit residual monomer content to below 0.5 mg/kg in potable applications have increased production costs. However, they also create opportunities for ultra-low-monomer products, which can be marketed at a premium price point.
Geography Analysis
In 2025, Asia-Pacific commands the flocculant and coagulant market with a 31.20% revenue share and is expected to grow at a 4.98% CAGR through 2031. China's PAC base, a dominant player, caters to regional textile, paper, and coal-chemical plants. Meanwhile, tighter discharge norms in Vietnam, Indonesia, and India have led to a threefold increase in chemical throughput in specific clusters. Japan and South Korea are at the forefront, employing AI-driven dosing to adhere to phosphorus caps of 0.2 mg/L. ASEAN nations, with backing from multilaterals, are upgrading municipal systems, yet procurement trends lean towards cost-effective producers from China and India.
North America may be expanding its volume at a slower pace, but it's spending more per ton on specialty coagulants and cloud-connected control platforms. Key initiatives like California's 2025 direct-potable-reuse rollout and Arizona's USD 1.2 billion water-reuse program are bolstering demand. Additionally, under New Mexico's 2024 act, the Permian Basin is reclaiming produced water for irrigation. In Canada, utilities are adopting low-dose PAC strategies to counter rising landfill fees for sludge, ensuring steady revenue despite only modest volume increases.
Europe's demand remains stable, particularly in Germany, the United Kingdom, France, and the Nordic countries. Energy price fluctuations are pushing a shift towards low-dose blends. France is incentivizing this shift with a EUR 500 million (~USD 585.06 million) subsidy plan for small utilities, especially rewarding those with ISO 9001 and NSF 60 certifications. While Spain's new irrigation reuse regulations boost coagulant use in Murcia and Almeria, budget limitations in Russia are restraining growth to a modest 1-2% annually. In South America and the Middle-East and Africa, niche opportunities arise in mining, desalination, and municipal zero liquid discharge (ZLD) projects, spurred by tightening effluent regulations in Brazil, copper tailings in Chile, and grand desalination initiatives in Saudi Arabia.
- Ashland Global Holdings Inc.
- BASF
- Buckman
- Chemtrade Logistics
- Dow
- Ecolab Inc.
- Feralco AB
- Grasim Industries Ltd.
- IXOM
- Kemira
- Kurita Water Industries Ltd.
- Nouryon
- SNF
- Solenis
- Solvay
- USALCO LLC
- Veolia Water Technologies
Additional Benefits:
- The market estimate (ME) sheet in Excel format
- 3 months of analyst support
TABLE OF CONTENTS
1 Introduction
- 1.1 Study Assumptions and Market Definition
- 1.2 Scope of the Study
2 Research Methodology
3 Executive Summary
4 Market Landscape
- 4.1 Market Overview
- 4.2 Market Drivers
- 4.2.1 Stricter discharge norms for emerging-market industrial clusters
- 4.2.2 Rapid build-out of zero-liquid-discharge (ZLD) power and petrochem plants
- 4.2.3 Re-use mandates in water-scarce regions
- 4.2.4 Mature utility spending cycles in North America and Europe
- 4.2.5 AI-enabled dosing control platforms boosting chemical efficiency
- 4.3 Market Restraints
- 4.3.1 Regulatory toxicity spotlight on acrylamide monomer residues
- 4.3.2 Input price spikes for aluminium and ferric salts
- 4.3.3 Growing preference for membrane and electro-coagulation hybrids
- 4.4 Value Chain Analysis
- 4.5 Regulatory Landscape
- 4.6 Porter's Five Forces
- 4.6.1 Threat of New Entrants
- 4.6.2 Bargaining Power of Buyers
- 4.6.3 Bargaining Power of Suppliers
- 4.6.4 Threat of Substitutes
- 4.6.5 Competitive Rivalry
5 Market Size and Growth Forecasts (Value)
- 5.1 By Type
- 5.1.1 Coagulants
- 5.1.1.1 Inorganic Coagulants
- 5.1.1.2 Organic/Synthetic Coagulants
- 5.1.1.3 Natural/Bio-based Coagulants
- 5.1.2 Flocculants
- 5.1.2.1 Cationic Flocculants
- 5.1.2.2 Anionic Flocculants
- 5.1.2.3 Non-ionic Flocculants
- 5.1.1 Coagulants
- 5.2 By Application
- 5.2.1 Municipal Water Treatment
- 5.2.2 Industrial Wastewater Treatment
- 5.2.2.1 Pulp and Paper
- 5.2.2.2 Mining and Mineral Processing
- 5.2.2.3 Oil and Gas
- 5.2.2.4 Power Generation
- 5.2.2.5 Construction and Infrastructure
- 5.3 By Geography
- 5.3.1 Asia-Pacific
- 5.3.1.1 China
- 5.3.1.2 Japan
- 5.3.1.3 India
- 5.3.1.4 South Korea
- 5.3.1.5 ASEAN
- 5.3.1.6 Rest of Asia-Pacific
- 5.3.2 North America
- 5.3.2.1 United States
- 5.3.2.2 Canada
- 5.3.2.3 Mexico
- 5.3.3 Europe
- 5.3.3.1 Germany
- 5.3.3.2 United Kingdom
- 5.3.3.3 France
- 5.3.3.4 Italy
- 5.3.3.5 Spain
- 5.3.3.6 Russia
- 5.3.3.7 Nordics
- 5.3.3.8 Rest of Europe
- 5.3.4 South America
- 5.3.4.1 Brazil
- 5.3.4.2 Argentina
- 5.3.4.3 Rest of South America
- 5.3.5 Middle-East and Africa
- 5.3.5.1 Saudi Arabia
- 5.3.5.2 South Africa
- 5.3.5.3 Rest of Middle-East and Africa
- 5.3.1 Asia-Pacific
6 Competitive Landscape
- 6.1 Market Concentration
- 6.2 Key Strategic Moves
- 6.3 Market Share(%)/Ranking Analysis
- 6.4 Company Profiles (includes Global level Overview, Market level overview, Core Segments, Financials as available, Strategic Information, Products and Services, and Recent Developments)
- 6.4.1 Ashland Global Holdings Inc.
- 6.4.2 BASF
- 6.4.3 Buckman
- 6.4.4 Chemtrade Logistics
- 6.4.5 Dow
- 6.4.6 Ecolab Inc.
- 6.4.7 Feralco AB
- 6.4.8 Grasim Industries Ltd.
- 6.4.9 IXOM
- 6.4.10 Kemira
- 6.4.11 Kurita Water Industries Ltd.
- 6.4.12 Nouryon
- 6.4.13 SNF
- 6.4.14 Solenis
- 6.4.15 Solvay
- 6.4.16 USALCO LLC
- 6.4.17 Veolia Water Technologies
7 Market Opportunities and Future Outlook
- 7.1 White-space and Unmet-Need Assessment
- 7.2 Rise of fully bio-based coagulants for hypersaline wastewater

