PUBLISHER: Mordor Intelligence | PRODUCT CODE: 2062036

PUBLISHER: Mordor Intelligence | PRODUCT CODE: 2062036
Precipitated Calcium Carbonate - Market Share Analysis, Industry Trends & Statistics, Growth Forecasts (2026 - 2031)
According to Mordor Intelligence, the precipitated calcium carbonate market size is projected to be 51.12 million tons in 2025, 53.46 Million tons in 2026, and reach 66.88 million tons by 2031, growing at a CAGR of 4.58% from 2026 to 2031.
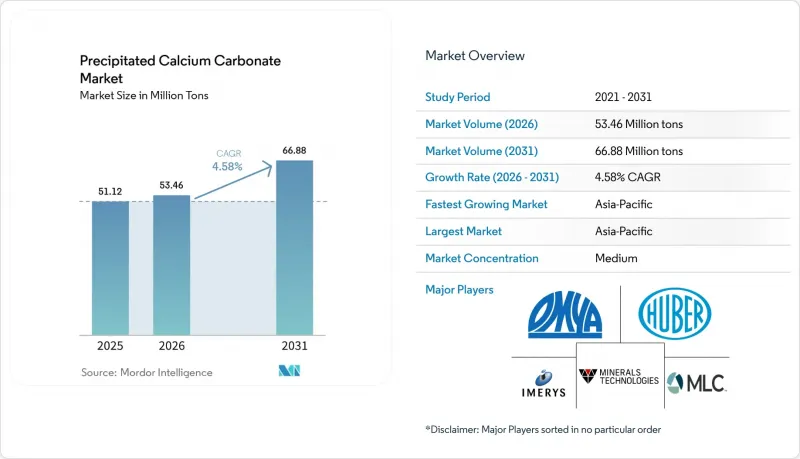
This report Segments the Industry by Application (Paper and Paperboard, Paints and Coatings, Adhesives and Sealants, and More), End-User Industry (Packaging, Construction and Infrastructure, Automotive and Transportation, and More), and Geography (Asia-Pacific, North America, Europe, South America, and the Middle East and Africa). The Market Forecasts are Provided in Terms of Volume (Tons).
Global Precipitated Calcium Carbonate Market Trends and Insights
Surging Demand From Premium Paper Grades
Brand owners are shifting toward high-opacity packaging and coated paper that rely on scalenohedral PCC to maximize light scattering, enabling filler loadings above 25% without sacrificing strength. Laboratory handsheets containing xylan-modified PCC showed brightness and opacity gains alongside improved burst and tear strength, letting mills downgrade fiber while protecting print quality. In Asia, where recycled-fiber loops dominate, nano-PCC replaces optical brightening agents that fade under UV, supporting cost-effective brightness control. Pilot trials using marble-waste-derived PCC achieved water contact angles of 103.3°, enhancing hydrophobicity for food wrappers. These results confirm that next-generation PCC provides aesthetic and sustainability benefits that pure fiber cannot match.
High-Fill Plastics for Lightweighting
Automotive and packaging converters incorporate up to 40% PCC masterbatch to curb resin costs and lower part weight, directly improving fuel economy. Polypropylene composites with 40% ground PCC posted a 69% rise in Young's modulus, though designers balance stiffness with ductility through particle-size control. Omya's Smartfill modified PCC sustained intrinsic viscosity in PET at 0.74 dL/g versus 0.61 dL/g for commodity PCC, boosting bottle top-load 40% at 5% filler, and enabling titanium dioxide cuts. Glass-fiber-epoxy parts filled with 6 wt% PCC reached 130.58 MPa tensile strength, opening pathways for lighter body panels in electric vehicles. Rising North American vehicle output of 15.5 million units in 2024, with 429 lb of plastics per car, underlines the latent plastics filler pull.
Limestone Price Volatility and Availability
The United States Geological Survey pegged lime output at 420 million tons in 2024, 72% of it from China, heightening concentration risk for importers. Quicklime prices rose to USD 190 per ton in 2024 as quarry permits tightened and fuel surcharges widened. High-purity deposits suitable for pharma-grade PCC are geographically scarce, forcing specialty producers to invest in beneficiation that stretches payback periods.
Other drivers and restraints analyzed in the detailed report include:
- Regulatory Push for VOC-Free Paints and Coatings
- Carbon-Negative PCC via CCU Routes
- Energy-Intensive Calcination and CO2 Footprint
For complete list of drivers and restraints, kindly check the Table Of Contents.
Segment Analysis
Global paper and paperboard retained 35.12% of 2025 volume as PCC fillers improved brightness and reduced fiber, a critical cost lever for mills. Nonetheless, pharmaceuticals and food applications are projected to grow at 6.77% CAGR, leveraging USP-grade purity to tap higher margins. Plastics applications, spanning Rigid Packaging, Flexible Films, and engineering resins, are expanding as lightweighting mandates and resin-cost inflation drive higher filler loadings, with surface-modified grades enabling 20-40% polymer substitution without sacrificing mechanical integrity.
Specialty excipient demand rests on clear United States FDA GRAS status under 21 CFR 184.1191 and color-additive exemptions that simplify global filings, creating barriers to entry. Controlled-release microspheres, imaging agents, and alginate, PCC hybrid carriers illustrate how particle engineering extends PCC beyond traditional antacid roles. Paper applications still anchor bulk tonnage, yet pricing power tilts toward trace-element-controlled, sub-micron grades that offer performance impossible for commodity fillers.
Geography Analysis
Asia-Pacific held 40.25% of global volume in 2025 and is forecast to expand at 5.05% CAGR through 2031. Minerals Technologies Inc. opened three new on-site PCC satellites in 2026 to serve Chinese and Indian paper mills, shrinking freight emissions and capturing just-in-time supply advantages. Japan and South Korea target nano-scale PCC for electronics and pharma, leveraging precise process control, while Vietnam and Indonesia welcome foreign direct investment in plastics compounding that lifts regional consumption. India's packaging sector, propelled by e-commerce and food safety mandates, escalates demand for coated PCC that meets Bureau of Indian Standards purity benchmarks.
In North America, Domtar and Omya's Wisconsin on-site plant, commissioned in 2024, recycles CO2 from the mill's lime kiln to make 27,500 dry tons per year of PCC, lowering annual transport emissions by 15,000 short tons CO2-equivalent. Automotive lightweighting in the United States and Mexico maintains demand for modified PCC in polypropylene, polyethylene, and polyamide parts. CarbonFree's SkyCycle project at United States Steel Gary brings the first large-scale Carbon Capture and Utilisation (CCU)-based PCC supply to North America, aligning with corporate climate targets and potentially capturing premium pricing from sustainability-focused buyers.
Europe, mixes strict environmental policy with mature demand in paints, coatings, and pharmaceuticals. European Union (EU) VOC (Volatile Organic Compound) ceilings, REACH (Registration, Evaluation, Authorisation and Restriction of Chemicals) regulations, and the looming PFAS (per- and polyfluoroalkyl substances) phase-out accelerate reformulation, steering formulators toward low-oil-absorption, non-fluorinated PCC grades. Germany leads automotive composites uptake, the United Kingdom advances in dietary supplements, and France and Italy anchor architectural-coating volumes. Outside the Big-Three regions, Brazil, Saudi Arabia, and South Africa post double-digit growth off small bases, though feedstock and logistics constraints moderate near-term scale-up.
- Cales de Llierca
- Carmeuse
- Changzhou Calcium Carbonate Co.
- Fimatec Ltd
- Gulshan Polyols Ltd
- HiTech Minerals and Chemicals Group
- Imerys
- J.M. Huber Corporation
- Lhoist
- Maruo Calcium Co. Ltd
- Minerals Technologies Inc.
- Mississippi Lime Company d/b/a MLC
- Nordkalk Corporation
- Omya
- SHIRAISHI CHEMICAL KAISHA, LTD
Additional Benefits:
- The market estimate (ME) sheet in Excel format
- 3 months of analyst support
TABLE OF CONTENTS
1 Introduction
- 1.1 Study Assumptions and Market Definition
- 1.2 Scope of the Study
2 Research Methodology
3 Executive Summary
4 Market Landscape
- 4.1 Market Overview
- 4.2 Market Drivers
- 4.2.1 Surging demand from premium paper and packaging grades
- 4.2.2 High-fill plastics for lightweighting
- 4.2.3 Regulatory push for VOC-free paints and coatings
- 4.2.4 Carbon-negative PCC via CCU routes
- 4.2.5 Nano-PCC improving opacity in recycled paper loops
- 4.3 Market Restraints
- 4.3.1 Limestone price volatility and availability
- 4.3.2 Energy-intensive calcination and CO2 footprint
- 4.3.3 PFAS scrutiny on fluorinated surface modifiers
- 4.4 Value Chain Analysis
- 4.5 Porter's Five Forces
- 4.5.1 Bargaining Power of Suppliers
- 4.5.2 Bargaining Power of Buyers
- 4.5.3 Threat of New Entrants
- 4.5.4 Threat of Substitutes
- 4.5.5 Degree of Competition
5 Market Size and Growth Forecasts (Volume)
- 5.1 By Application
- 5.1.1 Paper and Paperboard
- 5.1.2 Plastics
- 5.1.2.1 Rigid Packaging
- 5.1.2.2 Flexible Films
- 5.1.3 Paints and Coatings
- 5.1.4 Adhesives and Sealants
- 5.1.5 Rubber
- 5.1.6 Pharmaceuticals and Food
- 5.1.7 Personal Care and Cosmetics
- 5.1.8 Other Applications
- 5.2 By End-user Industry
- 5.2.1 Packaging
- 5.2.2 Construction and Infrastructure
- 5.2.3 Automotive and Transportation
- 5.2.4 Healthcare and Life Sciences
- 5.2.5 Consumer Goods and Electronics
- 5.2.6 Other End-user Industries
- 5.3 By Geography
- 5.3.1 Asia-Pacific
- 5.3.1.1 China
- 5.3.1.2 India
- 5.3.1.3 Japan
- 5.3.1.4 South Korea
- 5.3.1.5 Rest of Asia-Pacific
- 5.3.2 North America
- 5.3.2.1 United States
- 5.3.2.2 Canada
- 5.3.2.3 Mexico
- 5.3.3 Europe
- 5.3.3.1 Germany
- 5.3.3.2 United Kingdom
- 5.3.3.3 France
- 5.3.3.4 Italy
- 5.3.3.5 Russia
- 5.3.3.6 Rest of Europe
- 5.3.4 South America
- 5.3.4.1 Brazil
- 5.3.4.2 Argentina
- 5.3.4.3 Rest of South America
- 5.3.5 Middle East and Africa
- 5.3.5.1 Saudi Arabia
- 5.3.5.2 Turkey
- 5.3.5.3 South Africa
- 5.3.5.4 Rest of Middle East and Africa
- 5.3.1 Asia-Pacific
6 Competitive Landscape
- 6.1 Market Concentration
- 6.2 Strategic Moves
- 6.3 Market Share(%)/Ranking Analysis
- 6.4 Company Profiles (includes Global Overview, Market Overview, Core Segments, Financials, Strategic Information, Products and Services, Recent Developments)
- 6.4.1 Cales de Llierca
- 6.4.2 Carmeuse
- 6.4.3 Changzhou Calcium Carbonate Co.
- 6.4.4 Fimatec Ltd
- 6.4.5 Gulshan Polyols Ltd
- 6.4.6 HiTech Minerals and Chemicals Group
- 6.4.7 Imerys
- 6.4.8 J.M. Huber Corporation
- 6.4.9 Lhoist
- 6.4.10 Maruo Calcium Co. Ltd
- 6.4.11 Minerals Technologies Inc.
- 6.4.12 Mississippi Lime Company d/b/a MLC
- 6.4.13 Nordkalk Corporation
- 6.4.14 Omya
- 6.4.15 SHIRAISHI CHEMICAL KAISHA, LTD
7 Market Opportunities and Future Outlook
- 7.1 White-space and Unmet-need Assessment

