
PUBLISHER: Mordor Intelligence | PRODUCT CODE: 2062077

PUBLISHER: Mordor Intelligence | PRODUCT CODE: 2062077
Recycled Copper - Market Share Analysis, Industry Trends & Statistics, Growth Forecasts (2026 - 2031)
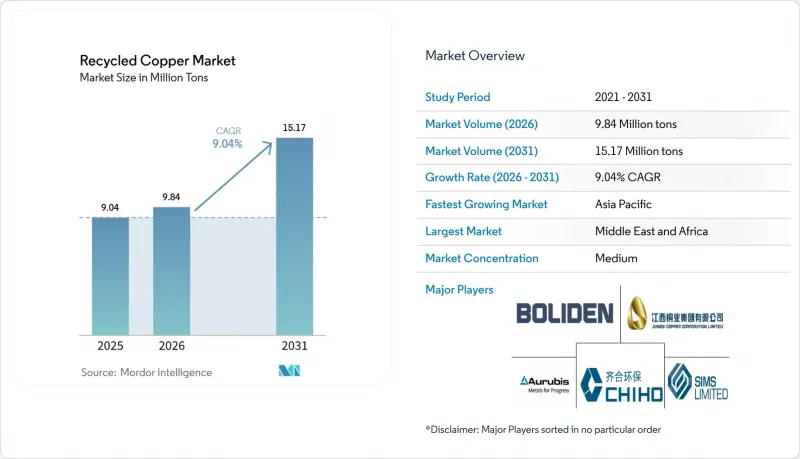
According to Mordor Intelligence, the recycled copper market size is projected to be 9.04 Million tons in 2025, 9.84 Million tons in 2026, and reach 15.17 Million tons by 2031, growing at a CAGR of 9.04% from 2026 to 2031.
This report is Segmented by Copper Type (Pure Copper and Copper Alloys), Source (Post-Consumer Scrap and Industrial Scrap), Process (Mechanical, Pyrometallurgical, and More), End-User Industry (Electrical and Electronics, and More), and Geography (Asia-Pacific, North America, and More). The Market Forecasts are Provided in Terms of Volume (Tons).
Global Recycled Copper Market Trends and Insights
Robust Demand from EV-Related Wiring and Battery Collectors
Battery electric vehicles contain 80-91 kg of copper, nearly three times the amount in internal combustion engine vehicles. Battery-pack current collectors yield 99.99%-purity copper foil, which can be mechanically liberated and electro-refined at 60% of the energy cost of primary smelting. China's production of 9.5 million EVs in 2025 is expected to generate a deferred scrap wave maturing after 2032. However, recyclers are already securing multi-year offtake agreements indexed to LME prices minus fixed discounts, ensuring feedstock availability. Tesla and BYD have disclosed pilot projects that reintegrate recovered collector copper directly into new cell lines, tightening merchant supply. The European Battery Regulation mandates 90% copper recovery from waste batteries by 2027, with non-compliance fines of up to EUR 500,000, driving hydrometallurgical investments in EUROPE. Automakers are redesigning harnesses with single-alloy connectors, improving post-shred yields by 12-15 percentage points, and enhancing recycled copper supply.
Growing Circular-Economy Mandates in the EU and China
The EU Waste Shipment Regulation, effective May 2026, bans copper scrap exports labeled as waste to non-OECD destinations starting in 2027. This forces European collectors to enhance domestic processing capabilities or accept lower regional prices. In contrast, China relaxed import purity rules in November 2025 and introduced a recycled-metals futures contract on the Shanghai Futures Exchange, increasing imported scrap to 2.34 million tons in 2025 despite geopolitical tariffs. The REPowerEU initiative targets 25% of critical minerals from recycled content by 2030, with public procurement scorecards awarding premiums of EUR 150-200 per ton for certified scrap. China's MIIT guidelines require major fabricators to source 30% secondary feed by 2028, fostering joint ventures between state-owned smelters and private scrap aggregators. These synchronized policies are reshaping the competitive landscape of the recycled copper market, pressuring recyclers without an auditable chain-of-custody system.
Scrap-Price Volatility Compressing Recycler Margins
In January 2026, LME copper reached a record USD 13,387 per ton before falling 8% by March, leaving recyclers who locked in high-priced feed with negative margins. Small processors operating on 60-day purchase terms and 30-day sales terms risk losing 40% of gross margins if prices drop by 10%. Regional disparities exacerbate challenges: export bans keep European prices elevated, while Southeast Asian inspections suppress local values, benefiting logistics-advantaged traders. The recycled copper market thus rewards hedged and diversified operators while penalizing those reliant on spot transactions.
Other drivers and restraints analyzed in the detailed report include:
- Copper-Price Hedging Tools Accessible to Recyclers
- OEM-Led Closed-Loop Alloy Qualification for Die-Casting
- Quality Variation and Contamination in Mixed Copper Streams
For complete list of drivers and restraints, kindly check the Table Of Contents.
Segment Analysis
Copper alloys are expected to grow at a 10.12% CAGR through 2031, significantly outpacing pure copper, as automakers approve recycled brass and bronze for use in die-casting, radiators, and heat exchangers. Suppliers incorporating No. 2 scrap directly into alloy production save USD 800-1,200 per ton compared to the cathode production method, enhancing their competitiveness. The implementation of ISO 22965 by late 2026 will standardize alloy chemistry, reducing qualification times by up to six weeks and promoting adoption across North America, Europe, and Japan.
Pure copper retained a 58.61% market share in 2025, driven by demand for grid wiring, data-center busbars, and inverters requiring 99.99% conductivity. Closed-loop programs with utilities ensure that decommissioned cables are sent directly to smelters, maintaining purity and stabilizing premiums. Aurubis aims to achieve 50% recycled content in cathodes by 2030, supporting investments in secondary refining. While alloy adoption reduces some volume, pure copper remains critical for high-conductivity applications, ensuring its continued importance in the recycled copper market.
Post-consumer scrap accounted for 53.45% of the 2025 supply, but industrial scrap is projected to grow at a 10.07% CAGR through 2031 as fabricators adopt compact granulators to capture margins previously outsourced. Wire and tube producers using systems from SWEED or CopperMine achieve 99.99% pure granules, commanding USD 1,000-1,400 per ton premiums over mixed scrap, with payback periods of 12 to 18 months.
Post-consumer scrap benefits from large-scale demolition projects and the anticipated retirement of EV batteries. However, its heterogeneous chemistry increases processing costs and certification challenges. Extended Producer Responsibility frameworks in Vietnam and the EU are improving collection, but fragmented dealer networks delay settlement cycles. Industrial scrap, with its consistent chemistry, reduces slag losses and supports hydrometallurgical processing, increasing its share in the recycled copper market.
Geography Analysis
Asia-Pacific held 39.25% of the recycled copper market share in 2025, driven by China's 2.34 million-tonne scrap imports and India's significant demand-supply gap. China's recycled-metals futures contract enhances hedging options, while India's Hindalco is expanding recycling capacity under a USD 10 billion investment plan. ASEAN nations, acting as processing hubs, are tightening impurity inspections, shifting trade flows toward certified operators.
The Middle-East and Africa, the fastest-growing region with a 10.09% CAGR through 2031, is supported by Oman's USD 106 million plant scaling to 12,000 tons by 2026 and Saudi Arabia's USD 100 billion mining initiative. Regional grid expansions of 40% by 2035 will create a deferred scrap pipeline, while Chinese and European smelters plan hub facilities to pre-clean mixed scrap for export.
In North America, U.S. tariffs redirect scrap inward, maintaining domestic margins, while Sims Limited upgrades separation lines across the region. Europe faces short-term challenges from rising power costs and the 2027 waste-export ban, but long-term demand for certified feedstock remains strong. South America's market share is modest, but Brazil's 12 GW of new renewable energy projects approved in 2025 position it as a future growth area, reflecting geographic rebalancing trends in the recycled copper market.
- Aurubis AG
- Boliden Group
- Calbag Metals Co.
- Chiho Environmental Group Limited
- CMC
- CRONIMET Holding GmbH
- Dowa Holdings Co., Ltd.
- European Metal Recycling Ltd.
- Glencore plc
- Gravita India Ltd.
- Hindalco Industries Ltd.
- Jiangxi Copper Company Limited
- Korea Zinc Co. (Sun Metals)
- Kuusakoski Oy
- Mitsubishi Materials Corporation
- OmniSource LLC
- Schnitzer Steel Industries, Inc.
- Sims Limited
- TSR Recycling GmbH & Co. KG
- Umicore
- Wieland-Werke AG
Additional Benefits:
- The market estimate (ME) sheet in Excel format
- 3 months of analyst support
TABLE OF CONTENTS
1 Introduction
- 1.1 Study Assumptions and Market Definition
- 1.2 Scope of the Study
2 Research Methodology
3 Executive Summary
4 Market Landscape
- 4.1 Market Overview
- 4.2 Market Drivers
- 4.2.1 Robust demand from EV-related wiring and battery collectors
- 4.2.2 Growing circular-economy mandates in the EU and China
- 4.2.3 Copper-price hedging tools accessible to recyclers
- 4.2.4 OEM-led closed-loop alloy qualification for die-casting
- 4.2.5 AI-enabled scrap sorting boosting high-grade recovery rates
- 4.3 Market Restraints
- 4.3.1 Scrap-price volatility compressing recycler margins
- 4.3.2 Quality variation and contamination in mixed copper streams
- 4.3.3 High cost of blockchain-based "green-copper" certification
- 4.4 Value Chain Analysis
- 4.5 Porter's Five Forces
- 4.5.1 Threat of New Entrants
- 4.5.2 Bargaining Power of Buyers
- 4.5.3 Bargaining Power of Suppliers
- 4.5.4 Threat of Substitutes
- 4.5.5 Competitive Rivalry
5 Market Size and Growth Forecasts (Volume)
- 5.1 By Copper Type
- 5.1.1 Pure Copper
- 5.1.2 Copper Alloys
- 5.2 By Source
- 5.2.1 Post-Consumer Scrap
- 5.2.2 Industrial Scrap
- 5.3 By Process
- 5.3.1 Mechanical Recycling
- 5.3.2 Pyrometallurgical Recycling
- 5.3.3 Hydrometallurgical Recycling
- 5.3.4 Combined Pyro-Hydro Routes
- 5.4 By End-user Industry
- 5.4.1 Electrical and Electronics
- 5.4.2 Building and Construction
- 5.4.3 Transportation
- 5.4.4 Industrial Equipment
- 5.4.5 Consumer Goods
- 5.4.6 Other End-user Industries (Telecom, etc.)
- 5.5 By Geography
- 5.5.1 Asia-Pacific
- 5.5.1.1 China
- 5.5.1.2 Japan
- 5.5.1.3 India
- 5.5.1.4 South Korea
- 5.5.1.5 ASEAN Countries
- 5.5.1.6 Rest of Asia-Pacific
- 5.5.2 North America
- 5.5.2.1 United States
- 5.5.2.2 Canada
- 5.5.2.3 Mexico
- 5.5.3 Europe
- 5.5.3.1 Germany
- 5.5.3.2 United Kingdom
- 5.5.3.3 France
- 5.5.3.4 Italy
- 5.5.3.5 Spain
- 5.5.3.6 Russia
- 5.5.3.7 NORDIC Countries
- 5.5.3.8 Rest of Europe
- 5.5.4 South America
- 5.5.4.1 Brazil
- 5.5.4.2 Argentina
- 5.5.4.3 Rest of South America
- 5.5.5 Middle-East and Africa
- 5.5.5.1 Saudi Arabia
- 5.5.5.2 South Africa
- 5.5.5.3 Rest of Middle-East and Africa
- 5.5.1 Asia-Pacific
6 Competitive Landscape
- 6.1 Market Concentration
- 6.2 Strategic Moves
- 6.3 Market Share (%)/Ranking Analysis
- 6.4 Company Profiles (includes Global level Overview, Market level overview, Core Segments, Financials as available, Strategic Information, Products and Services, and Recent Developments)
- 6.4.1 Aurubis AG
- 6.4.2 Boliden Group
- 6.4.3 Calbag Metals Co.
- 6.4.4 Chiho Environmental Group Limited
- 6.4.5 CMC
- 6.4.6 CRONIMET Holding GmbH
- 6.4.7 Dowa Holdings Co., Ltd.
- 6.4.8 European Metal Recycling Ltd.
- 6.4.9 Glencore plc
- 6.4.10 Gravita India Ltd.
- 6.4.11 Hindalco Industries Ltd.
- 6.4.12 Jiangxi Copper Company Limited
- 6.4.13 Korea Zinc Co. (Sun Metals)
- 6.4.14 Kuusakoski Oy
- 6.4.15 Mitsubishi Materials Corporation
- 6.4.16 OmniSource LLC
- 6.4.17 Schnitzer Steel Industries, Inc.
- 6.4.18 Sims Limited
- 6.4.19 TSR Recycling GmbH & Co. KG
- 6.4.20 Umicore
- 6.4.21 Wieland-Werke AG
7 Market Opportunities and Future Outlook
- 7.1 White-space and Unmet-Need Assessment
- 7.2 Bio-leaching Process to Extract Copper from E-waste

