
PUBLISHER: Mordor Intelligence | PRODUCT CODE: 2062108

PUBLISHER: Mordor Intelligence | PRODUCT CODE: 2062108
Cyber Ranges And Simulation Platforms - Market Share Analysis, Industry Trends & Statistics, Growth Forecasts (2025 - 2030)
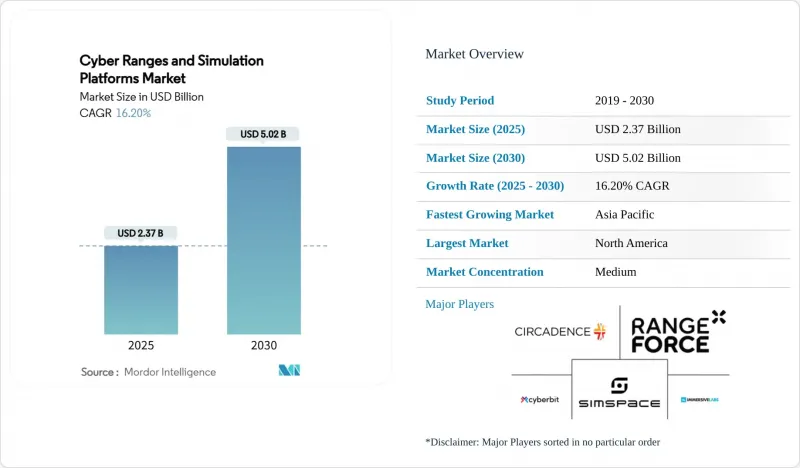
According to Mordor Intelligence, the cyber ranges and simulation platforms market size reached USD 2.37 billion in 2025 and is forecast to advance to USD 5.02 billion by 2030, posting a sturdy 16.2% CAGR.
This report is Segmented by Component (Software and Services), Range Type (Simulation Range, Emulation Range, and More), Deployment Mode (On-Premises, Cloud-Based, and Hybrid), End-User (Defense and Security Agencies, BFSI, and More), Application (Training and Certification, Threat Intelligence and Analysis, and More), and Geography. The Market Forecasts are Provided in Terms of Value (USD).
Global Cyber Ranges And Simulation Platforms Market Trends and Insights
Surging Cyber-Attack Frequency Across Critical Infrastructure
Manufacturing, energy, and transport operators now experience record ransomware volumes, with Singapore's Cyber Security Agency logging 132 incidents in 2023 that mainly struck industrial environments. This escalation propels demand for operational-technology ranges embedding real controllers and sensor networks. Idaho National Laboratory's expanded ICS programs illustrate how authentic equipment enriches scenario fidelity. Exercises such as Liberty Eclipse and GridEx VII underline coordination gaps between cyber teams and grid operators, reinforcing the need for multi-disciplinary simulations. Energy utilities now view cyber training as a safety imperative because failures can trigger physical disruptions. The U.S. Department of Energy's CyTRICS initiative confirms the trend by stress-testing energy components inside purpose-built ranges.
Escalating Regulatory-Mandated Cyber-Readiness Drills
Financial watchdogs require evidence-based drills rather than policy checklists. New York's updated 23 NYCRR 500 forces banks to run penetration tests and incident simulations each year. Europe's DORA imposes harmonised operational-resilience testing across the bloc. FINRA's 2025 oversight report flags AI-enabled phishing as a top risk and advises member firms to use ranges for response rehearsals. These rules generate continuous demand for platforms that log participant metrics and produce audit-ready evidence, shifting buying criteria from feature lists to outcome documentation.
High Capital Outlay for Immersive Physical Ranges
Building physical ranges with real switches, PLCs, and SCADA equipment can top USD 1 million. HP's Wolf Security report shows that 60% of buyers overlook security during device procurement, inflating retrofit budgets. Industrial buyers must also fund power, cooling, and secure facilities, making pure physical builds untenable for many. Virtualised ranges reduce spend, yet certain kinetic scenarios-such as power-grid failovers-still require tangible gear. Organisations therefore delay investment or adopt limited-scope pilots, restraining near-term growth in the cyber ranges and simulation platforms market.
Other drivers and restraints analyzed in the detailed report include:
- Defense Digital-Twin Adoption for Mission Rehearsal
- Cloud-Native Range Delivery Lowers TCO for SMEs
- Shortage of Skilled Cyber-Range Content Developers
For complete list of drivers and restraints, kindly check the Table Of Contents.
Segment Analysis
Software engines delivered 57.3% of 2024 revenue, underscoring the role of hypervisors, orchestration layers, and analytics dashboards in building realism. Within this domain, AI-assisted threat generation and drag-and-drop network builders reduce scenario lead times. However, enterprises increasingly outsource the heavy lifting. The services segment is tracking an 18.1% CAGR as buyers prefer turnkey curriculum design, live coaching, and post-exercise remediation guidance. Managed providers operate continuous-learning cycles where scenarios update weekly, ensuring relevance without internal headcount strain. This pivot signals that the cyber ranges and simulation platforms market is maturing from a product to an outcome economy.
In practice, providers like Cloud Range embed commercial SIEM, firewall, and EDR stacks inside their ranges so that blue teams rehearse using the same tooling seen in production. Post-event analytics translate performance data into board-level metrics such as mean-time-to-detect. As these insights feed risk dashboards, more CISOs justify subscription renewals, fortifying recurring revenue streams that underpin market stability.
Virtual simulation ranges held 44.3% of the 2024 share thanks to their low entry cost and linear scalability. Universities deploy hundreds of concurrent student pods without physical racks, while enterprises use simulation to certify new hires before granting production access. Yet hybrid designs that marry virtual layers with select physical assets are scaling fastest at 17.3% CAGR. Oil-and-gas majors, for instance, insert actual PLC racks into virtual pipelines to emulate sensor latency and signal noise. The combination supports high-fidelity rehearsals without building entire plants in a lab.
Overlay and emulation ranges cater to niche, protocol-level testing where packet timing or device firmware nuances are mission-critical. Although smaller in absolute dollars, these niches often command premium pricing because of specialised equipment and content.
Geography Analysis
North America generated 38.3% of 2024 revenue, anchored by generous federal budgets and stringent state-level regulations. The Department of Energy's OTDefender fellowship funnels graduates into utilities, amplifying local demand for OT-focused ranges. Commercial adoption is further propelled by widespread cloud readiness, enabling rapid SaaS onboarding across mid-market firms. Canada and Mexico participate through cross-border grid-security programmes, though their share is modest relative to the United States.
Asia-Pacific is the fastest-growing theatre at 17.0% CAGR to 2030. Singapore's Cyber Defence Test and Evaluation Centre offers federated access to academic, military, and private-sector teams. Japan's CyberKONGO2025 exercise spans 17 nations and demonstrates regional appetite for coalition interoperability. Meanwhile, India and China channel national-security investments into sovereign ranges that reflect unique telecommunications stacks, underscoring localisation imperatives within the cyber ranges and simulation platforms market.
Europe maintains steady momentum under DORA compliance, joint cyber exercises, and national range build-outs. Germany and France prioritise defence applications, while the UK accelerates financial-sector drills. ECSO's feature checklist fosters vendor comparison, nudging the market towards interoperability. Elsewhere, Middle East and Africa buyers emphasise energy and telecom protection, leveraging government-funded programmes in the Gulf and South Africa to jump-start local talent pipelines.
- SimSpace Corporation
- Cyberbit Ltd.
- RangeForce Inc.
- Immersive Labs Ltd.
- Circadence Corporation
- ThreatGEN LLC
- Offensive Security Services, LLC
- Raytheon Intelligence and Space
- Lockheed Martin Corporation
- Northrop Grumman Corporation
- CAE Inc.
- L3Harris Technologies, Inc.
- IBM Corporation
- Airbus Defence and Space SAS
- Atos SE
- Science Applications International Corp.
- Leidos Holdings, Inc.
- Thales Group
- Mandiant (a Google LLC company)
- Palo Alto Networks, Inc.
Additional Benefits:
- The market estimate (ME) sheet in Excel format
- 3 months of analyst support
TABLE OF CONTENTS
1 INTRODUCTION
- 1.1 Study Assumptions and Market Definition
- 1.2 Scope of the Study
2 RESEARCH METHODOLOGY
3 EXECUTIVE SUMMARY
4 MARKET LANDSCAPE
- 4.1 Market Overview
- 4.2 Market Drivers
- 4.2.1 Surging cyber-attack frequency across critical infrastructure
- 4.2.2 Escalating regulatory-mandated cyber-readiness drills
- 4.2.3 Defense digital-twin adoption for mission rehearsal
- 4.2.4 Cloud-native range delivery lowers TCO for SMEs
- 4.2.5 Generative-AI powered threat emulation accelerators
- 4.2.6 Integration with 5G/OT testbeds for converged security
- 4.3 Market Restraints
- 4.3.1 High capital outlay for immersive physical ranges
- 4.3.2 Shortage of skilled cyber-range content developers
- 4.3.3 Inter-operability gaps between proprietary range stacks
- 4.3.4 Data-sovereignty concerns in cross-border range sharing
- 4.4 Value Chain Analysis
- 4.5 Regulatory Landscape
- 4.6 Technological Outlook
- 4.7 Porter's Five Forces Analysis
- 4.7.1 Threat of New Entrants
- 4.7.2 Bargaining Power of Buyers
- 4.7.3 Bargaining Power of Suppliers
- 4.7.4 Threat of Substitutes
- 4.7.5 Intensity of Competitive Rivalry
- 4.8 Impact of Macroeconomic Factors on the Market
5 MARKET SIZE AND GROWTH FORECASTS (VALUES)
- 5.1 By Component
- 5.1.1 Software
- 5.1.2 Services
- 5.2 By Range Type
- 5.2.1 Simulation Range
- 5.2.2 Emulation Range
- 5.2.3 Hybrid Range
- 5.2.4 Overlay Range
- 5.3 By Deployment Mode
- 5.3.1 On-Premises
- 5.3.2 Cloud-Based
- 5.3.3 Hybrid
- 5.4 By End-user
- 5.4.1 Defense and Security Agencies
- 5.4.2 BFSI
- 5.4.3 IT and Telecom
- 5.4.4 Healthcare
- 5.4.5 Industrial and Critical Infrastructure
- 5.4.6 Academic and Training Institutes
- 5.4.7 Other End-users
- 5.5 By Application
- 5.5.1 Training and Certification
- 5.5.2 Threat Intelligence and Analysis
- 5.5.3 Research and Development / Testing
- 5.5.4 Compliance and Assessment
- 5.6 By Geography
- 5.6.1 North America
- 5.6.1.1 United States
- 5.6.1.2 Canada
- 5.6.1.3 Mexico
- 5.6.2 South America
- 5.6.2.1 Brazil
- 5.6.2.2 Argentina
- 5.6.2.3 Chile
- 5.6.2.4 Rest of South America
- 5.6.3 Europe
- 5.6.3.1 Germany
- 5.6.3.2 United Kingdom
- 5.6.3.3 France
- 5.6.3.4 Italy
- 5.6.3.5 Spain
- 5.6.3.6 Rest of Europe
- 5.6.4 Asia-Pacific
- 5.6.4.1 China
- 5.6.4.2 Japan
- 5.6.4.3 India
- 5.6.4.4 South Korea
- 5.6.4.5 Australia
- 5.6.4.6 Singapore
- 5.6.4.7 Malaysia
- 5.6.4.8 Rest of Asia-Pacific
- 5.6.5 Middle East and Africa
- 5.6.5.1 Middle East
- 5.6.5.1.1 Saudi Arabia
- 5.6.5.1.2 United Arab Emirates
- 5.6.5.1.3 Turkey
- 5.6.5.1.4 Rest of Middle East
- 5.6.5.2 Africa
- 5.6.5.2.1 South Africa
- 5.6.5.2.2 Nigeria
- 5.6.5.2.3 Rest of Africa
- 5.6.5.1 Middle East
- 5.6.1 North America
6 COMPETITIVE LANDSCAPE
- 6.1 Market Concentration
- 6.2 Strategic Moves
- 6.3 Market Share Analysis
- 6.4 Company Profiles (includes Global level Overview, Market level overview, Core Segments, Financials as available, Strategic Information, Market Rank/Share for key companies, Products and Services, and Recent Developments)
- 6.4.1 SimSpace Corporation
- 6.4.2 Cyberbit Ltd.
- 6.4.3 RangeForce Inc.
- 6.4.4 Immersive Labs Ltd.
- 6.4.5 Circadence Corporation
- 6.4.6 ThreatGEN LLC
- 6.4.7 Offensive Security Services, LLC
- 6.4.8 Raytheon Intelligence and Space
- 6.4.9 Lockheed Martin Corporation
- 6.4.10 Northrop Grumman Corporation
- 6.4.11 CAE Inc.
- 6.4.12 L3Harris Technologies, Inc.
- 6.4.13 IBM Corporation
- 6.4.14 Airbus Defence and Space SAS
- 6.4.15 Atos SE
- 6.4.16 Science Applications International Corp.
- 6.4.17 Leidos Holdings, Inc.
- 6.4.18 Thales Group
- 6.4.19 Mandiant (a Google LLC company)
- 6.4.20 Palo Alto Networks, Inc.
7 MARKET OPPORTUNITIES AND FUTURE OUTLOOK
- 7.1 White-space and Unmet-Need Assessment

