
PUBLISHER: Mordor Intelligence | PRODUCT CODE: 2062118

PUBLISHER: Mordor Intelligence | PRODUCT CODE: 2062118
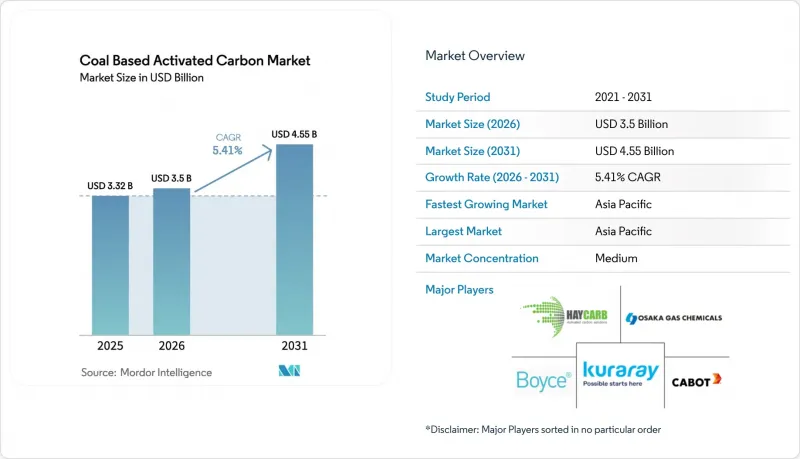
Coal Based Activated Carbon - Market Share Analysis, Industry Trends & Statistics, Growth Forecasts (2026 - 2031)
According to Mordor Intelligence, the coal-Based activated carbon market size is projected to be USD 3.32 billion in 2025, USD 3.5 billion in 2026, and reach USD 4.55 billion by 2031, growing at a CAGR of 5.41% from 2026 to 2031.
This report is Segmented by Product Type (Powdered, Granular, Extruded/Pelletized, and Bead and Felt), Activation Process (Steam, Carbon Dioxide, Phosphoric Acid, and Zinc Chloride), Application (Water/Wastewater, Air/Flue-Gas, Food/Beverage, Pharmaceutical, Mining, and Other), and Geography (Asia-Pacific, North America, Europe, and More). Market Forecasts are Provided in Terms of Value (USD).
Global Coal Based Activated Carbon Market Trends and Insights
Stricter Air-Emission Norms Boosting Flue-Gas Purification
In 2024, the U.S. MATS rule and China's ultra-low-emission standards mandate power and cement plants to inject high-iodine-number powdered activated carbon. Suppliers near the Inner Mongolia and Shanxi coal basins are securing supply contracts tied to the thermal-coal benchmarks, a move that stabilizes gross margins amid feedstock fluctuations. In the EU, while biomass-based carbons command a premium, biomass co-firing plants are racing to meet the 2026 BAT conclusions, resulting in a surge in pilot orders. These regulations bolster the coal-based activated carbon market, as operators treat flue gas to maintain their operational licenses. Facilities that ensure minimal sulfur bleed-through and rapid adsorption kinetics stand to gain significantly, even with fluctuating load factors.
PFAS-Driven Ultra-Trace Standards for Potable-Water Utilities
In April 2024, the EPA set Maximum Contaminant Levels for six PFAS compounds at 4 ppt. They also identified coal-based granular activated carbon as the Best Available Technology for treating waters with total PFAS levels below 100 ppt. In response, utilities serving millions of U.S. residents entered into take-or-pay regeneration contracts, avoiding landfill liabilities for spent sorbent. Kuraray had anticipated the U.S. market opportunity to grow significantly by 2030. To capitalize, the company enhanced both virgin and reactivation capacities, aiming to secure a substantial share of that market. Meanwhile, India proposed a draft PFAS limit in line with EU Standards, signaling increased demand in South-Asia. These developments have driven the coal-based activated carbon market toward a service-oriented revenue model, favoring vertically integrated suppliers.
Price Volatility and Logistics Risk in Coal Feedstock
In 2024, quarterly fluctuations in seaborne coal prices were influenced by factors such as weather conditions, Indonesian export quotas, and Chinese import policies. European producers, who rely heavily on imports, are seeing a significant increase in their landed coal costs due to rising freight charges. Smaller producers, bound by short-term procurement contracts, are experiencing margin compression as spikes in feedstock prices outpace the repricing of their contracts. In contrast, producers with captive mines in Shanxi or long-term offtakes in the U.S. Illinois Basin are enjoying higher EBITDA margins than those buying at spot prices. While efforts to enhance coal fines from wash-plants have led to carbons with iodine numbers in a limited range, this constraint restricts their use to low-value dye-removal markets and diminishes their potential in the coal-based activated carbon sector.
Other drivers and restraints analyzed in the detailed report include:
- Surge in Gold-Ore Cyanidation Recovery Circuits
- Adoption of Carbon-Capture Sorbents for Cement and Steel Kilns
- Competition from Biomass-Based Activated Carbon
For complete list of drivers and restraints, kindly check the Table Of Contents.
Segment Analysis
In 2025, the market saw granulated activated carbon holding a dominant 41.12% share. However, projections indicate that during the forecast period of 2026-2031, both extruded and pelletized forms are poised to expand at a vigorous 5.89% CAGR, outpacing all other categories. Within the chemicals and refining sectors, energy-intensive VOC scrubbers are increasingly leaning towards extruded pellets. These pellets not only reduce fan energy consumption but also lead to substantial savings in operating expenses, prompting a shift in specifications toward cylindrical media.
Osaka Gas Chemicals has bolstered Japan's coal-based activated carbon market by activating new presses. This, combined with binder advancements that enhance BET surface areas, has fueled steady growth for extruded products. While powdered forms play a pivotal role in emergency water remediation and pharmaceutical purification, bead and felt derivatives cater to niche applications in medical devices. However, the high capital investment required for a 10,000-ton line confines extrusion to financially robust players, resulting in a moderate concentration within this segment of the coal-based activated carbon market.
Geography Analysis
In 2025, the Asia-Pacific region dominated the global stage, capturing a notable 43.22% share of the global market and charting a robust projected CAGR of 5.96% for the forecast period 2026-2031. China, while a significant producer, turned to imports, acquiring premium products at prices considerably above the average export rates. This trend highlighted the resilience and demand for specialty grades in the coal-based activated carbon market. In India, production levels, combined with reduced logistics costs in Andhra Pradesh and Odisha, paved the way for enhanced regional self-sufficiency. Meanwhile, the Philippines showcased the cost benefits of blended feedstock, making it an attractive proposition for buyers in Japan and South Korea.
North America, particularly the United States, played a pivotal role in the 2025 demand landscape, largely influenced by stringent PFAS regulations and mercury limits that leaned towards regeneration contracts. Canada's oil-sands water circuits and Mexico's vibrant food processing industry further enriched the regional dynamics. Europe, while holding a significant market share, faced challenges with rising coal prices and ESG capital pressures. These factors nudged producers to pivot towards reactivation kilns, increasingly powered by renewable energy. In South America, buoyed by gold outputs from Peru and Chile, the market witnessed steady growth. The Middle-East and Africa, though modest in their global share, carved out niches in desalination pre-treatment and gold projects in West Africa. These intricate regional dynamics collectively shaped a balanced global growth trajectory for the coal-based activated carbon market.
- Active Char Pvt. Ltd.
- Boyce Carbon Ltd
- Cabot Corporation
- Carbon Activated Corporation
- Carbotech
- Donau Carbon US LLC
- Eurocarb Products Limited
- Haycarb PLC
- Jacobi Carbons Group
- KURARAY CO., LTD.
- KUREHA CORPORATION
- Osaka Gas Chemicals
Additional Benefits:
- The market estimate (ME) sheet in Excel format
- 3 months of analyst support
TABLE OF CONTENTS
1 Introduction
- 1.1 Study Assumptions and Market Definition
- 1.2 Scope of the Study
2 Research Methodology
3 Executive Summary
4 Market Landscape
- 4.1 Market Overview
- 4.2 Market Drivers
- 4.2.1 Stricter air-emission norms boosting flue-gas purification
- 4.2.2 PFAS-driven ultra-trace standards for potable-water utilities
- 4.2.3 Surge in gold-ore cyanidation recovery circuits
- 4.2.4 Adoption of carbon-capture sorbents for cement and steel kilns
- 4.2.5 Emergence of "regeneration-as-a-service" business models
- 4.3 Market Restraints
- 4.3.1 Price volatility and logistics risk in coal feedstock
- 4.3.2 Competition from biomass-based activated carbon
- 4.3.3 ESG-driven capital withdrawal from coal supply chains
- 4.4 Value Chain Analysis
- 4.5 Porter's Five Forces
- 4.5.1 Threat of New Entrants
- 4.5.2 Bargaining Power of Buyers
- 4.5.3 Bargaining Power of Suppliers
- 4.5.4 Threat of Substitutes
- 4.5.5 Competitive Rivalry
5 Market Size and Growth Forecasts (Value)
- 5.1 By Product Type
- 5.1.1 Powdered Activated Carbon (PAC)
- 5.1.2 Granular Activated Carbon (GAC)
- 5.1.3 Extruded/Pelletized Carbon Block
- 5.1.4 Bead and Felt Activated Carbon
- 5.2 By Activation Process
- 5.2.1 Steam Activation
- 5.2.2 Carbon Dioxide Activation
- 5.2.3 Phosphoric Acid
- 5.2.4 Zinc Chloride
- 5.3 By Application
- 5.3.1 Water and Wastewater Treatment
- 5.3.2 Air and Flue-Gas Purification
- 5.3.3 Food and Beverage Processing
- 5.3.4 Pharmaceutical and Medical Uses
- 5.3.5 Mining (Gold Recovery)
- 5.3.6 Other Applications (Industrial Solvent Recovery, Biogas and Hydrogen Purification, etc.)
- 5.4 By Geography
- 5.4.1 Asia-Pacific
- 5.4.1.1 China
- 5.4.1.2 Japan
- 5.4.1.3 India
- 5.4.1.4 South Korea
- 5.4.1.5 ASEAN Countries
- 5.4.1.6 Rest of Asia-Pacific
- 5.4.2 North America
- 5.4.2.1 United States
- 5.4.2.2 Canada
- 5.4.2.3 Mexico
- 5.4.3 Europe
- 5.4.3.1 Germany
- 5.4.3.2 United Kingdom
- 5.4.3.3 France
- 5.4.3.4 Italy
- 5.4.3.5 Spain
- 5.4.3.6 Russia
- 5.4.3.7 NORDIC Countries
- 5.4.3.8 Rest of Europe
- 5.4.4 South America
- 5.4.4.1 Brazil
- 5.4.4.2 Argentina
- 5.4.4.3 Rest of South America
- 5.4.5 Middle-East and Africa
- 5.4.5.1 Saudi Arabia
- 5.4.5.2 South Africa
- 5.4.5.3 Rest of Middle-East and Africa
- 5.4.1 Asia-Pacific
6 Competitive Landscape
- 6.1 Market Concentration
- 6.2 Strategic Moves
- 6.3 Market Share (%)/Ranking Analysis
- 6.4 Company Profiles (includes Global Overview, Market Overview, Core Segments, Financials, Strategic Information, Products and Services, and Recent Developments)
- 6.4.1 Active Char Pvt. Ltd.
- 6.4.2 Boyce Carbon Ltd
- 6.4.3 Cabot Corporation
- 6.4.4 Carbon Activated Corporation
- 6.4.5 Carbotech
- 6.4.6 Donau Carbon US LLC
- 6.4.7 Eurocarb Products Limited
- 6.4.8 Haycarb PLC
- 6.4.9 Jacobi Carbons Group
- 6.4.10 KURARAY CO., LTD.
- 6.4.11 KUREHA CORPORATION
- 6.4.12 Osaka Gas Chemicals
7 Market Opportunities and Future Outlook
- 7.1 White-space and Unmet-Need Assessment

