
PUBLISHER: Mordor Intelligence | PRODUCT CODE: 2062171

PUBLISHER: Mordor Intelligence | PRODUCT CODE: 2062171
Voice User Interface - Market Share Analysis, Industry Trends & Statistics, Growth Forecasts (2026 - 2031)
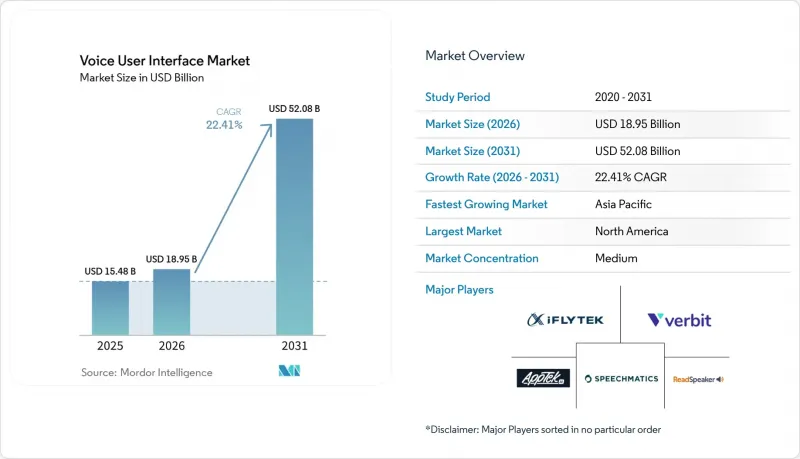
According to Mordor Intelligence, the voice user interface market size was valued at USD 15.48 billion in 2025 and estimated to grow from USD 18.95 billion in 2026 to reach USD 52.08 billion by 2031, at a CAGR of 22.41% during the forecast period (2026-2031).
This report is Segmented by Component (Software, Hardware, and Services), Deployment Mode (On-Premises, and Cloud), Application Vertical (Consumer Electronics, Automotive, Healthcare, BFSI, Retail and E-Commerce, Education, and More), Technology Stack (Edge AI Processing, Cloud-Based Processing, and Hybrid Processing), and Geography. The Market Forecasts are Provided in Terms of Value (USD).
Global Voice User Interface Market Trends and Insights
Advances in Deep-Learning Speech Recognition Accuracy
Transformer architectures cut production word-error rates to 5.42% in 2025, a 40% lift over 2023 recurrent networks. Contextual-biasing techniques allow voice interfaces to parse legal, medical, and financial jargon without bespoke retraining, expanding use in high-stakes environments such as trading floors and operating rooms. Academic REB-former research prunes redundant attention heads, reducing edge-device latency to 180 milliseconds and making real-time interaction feasible for wearables. With the threshold crossed, enterprises now elevate voice from secondary input to primary control, accelerating deployments across verticals that once relied on keyboards and touchscreens.
On-Device Edge AI Chips Enabling Offline Voice Processing
Specialized neural processing units reach 10 TOPS at sub-500 milliwatt power budgets, placing 1 billion-parameter models inside smartphones and car head units.[3] Mercedes-Benz, for instance, achieves sub-200 millisecond execution in the 2026 E-Class by pairing local wake-word detection with mid-tier transcription models. Offline inference decouples performance from network quality, a decisive benefit in automotive and industrial sites where coverage is spotty. Volume economics follow: ChipIntelli shipped 15 million USD 2.80 chips in 2025, enabling battery-powered sensors, locks, and thermostats to add reliable voice control.
Persistent Privacy and Data-Security Concerns
Biometric voiceprints fall under sensitive-data clauses in the General Data Protection Regulation, and 68% of surveyed consumers remain unsure how assistants store or share recordings. The United States Federal Trade Commission settlement with Amazon over child data amplified skepticism, knocking 12 percentage points off purchase intent among parents. Enterprises now adopt on-device processing and zero-retention policies. Nuance's Dragon Medical One keeps only de-identified text, adding roughly USD 1.2 million to project budgets but securing Health Insurance Portability and Accountability Act compliance. Until transparent governance frameworks solidify, privacy anxiety will mute uptake in healthcare, banking, and education.
Other drivers and restraints analyzed in the detailed report include:
- Proliferation of Smart Speakers and Voice-First Consumer Devices
- Growing Integration of VUI in Automotive Infotainment
- Acoustic and Accent Variability Reducing Recognition Accuracy
For complete list of drivers and restraints, kindly check the Table Of Contents.
Segment Analysis
Services advanced from a supporting role to a growth engine as enterprises widen deployments beyond turnkey packages. Software retained 57.16% share in 2025, but services are slated to compound at 23.18% annually through 2031, eclipsing both software and hardware expansion. Large rollouts, such as a 2025 hospital implementation of Nuance DAX Copilot, demanded 180 integration hours, accent tuning for 40 physician vocabularies, and compliance documentation, yielding USD 340,000 in professional-services revenue per site. The voice user interface market size for services is therefore scaling faster than the core licensing pool, driven by recurring retraining needs as natural language evolves.
Hardware remains essential in the value chain, bundling beamforming microphones, digital signal processors, and neural processing units on cost-efficient dies. Anker's Thus chip ships in multimillion-unit volumes at USD 4.20, bundling six-microphone arrays with 1 TOPS inference, elevating far-field capture quality. Continuous-learning contracts add another layer of stickiness: accuracy drifts 4-7 percentage points each year unless datasets are refreshed quarterly, creating annuity revenue for speech-specialist consultancies. This interdependence between code, silicon, and services sustains a balanced component mix even as customization accelerates.
Cloud deployments controlled 63.22% of 2025 revenue, propelled by GPU pooling that drops inference cost to USD 0.005-0.02 per audio minute, well below on-premises economics. OpenAI's GPT-4o voice mode hits 232-320 millisecond latency at USD 5 per million input tokens. Such metrics keep the voice user interface market leaning toward the cloud for complex reasoning and multimodal tasks. Nevertheless, hybrid routing processing wakes word triggers locally, then shipping only context-dependent queries has emerged as the operational norm, resolving 70-80% of standard utterances on-device and containing bandwidth demand.
On-premises installations, although smaller in absolute value, post an 18.90% CAGR due to data-sovereignty laws in China and India that forbid biometric prints from leaving national borders. iFlytek's hospital deployments remain entirely inside local data centers to satisfy Personal Information Protection Law rules, lifting per-seat licenses 40% yet securing regulatory clearance. Multinational vendors must now sustain dual product tracks, public cloud and sovereign on-premises, raising engineering complexity but widening the voice user interface market share they can address without legal hindrance.
Geography Analysis
North America led with 38.23% of 2025 revenue. A mature 300 million smart-speaker base and early Federal Trade Commission rule-setting gave enterprises legal clarity, prompting aggressive healthcare implementations. The region's 20.80% forecast CAGR trails the global average because consumer penetration now plateaus at 62% of households. The United States accounts for 78% of regional revenue, locked in by ecosystem switching costs that deter users from leaving Alexa or Siri setups. Canada and Mexico, at 14% and 8% respectively, accelerate bilingual rollouts, leveraging recent improvements in code-switched accuracy.
Asia-Pacific posts the fastest 24.17% CAGR. China owns the majority of regional revenue on the strength of Baidu's DuerOS, which fields 8.3 billion monthly queries across electric vehicles and smart homes. India holds a smaller slice, propelled by tier-2 city adoption and vernacular speech models that resonate with first-time internet users. Japan and South Korea emphasize on-device processing to align with 2025 privacy amendments, and the Association of Southeast Asian Nations markets struggle with dialect fragmentation, raising barriers to smaller entrants but opening room for regional champions.
Europe captures 21.40% of global revenue. Growth, forecast at 22.60% CAGR, is paced by automotive mandates requiring voice to mitigate driver distraction. However, EU Artificial Intelligence Act Tier-II disclosures add 8-12% compliance overhead, nudging smaller vendors to exit or partner. South America, though only 6.20% of worldwide revenue, expands at 23.40% CAGR behind Portuguese-language voice banking in Brazil. Middle East and Africa, at 5.80%, see early Arabic voice deployments, but dialect diversity and limited public corpora keep accuracy gaps wide, slowing uptake outside government and telecom pilots.
- Amazon.com, Inc.
- Google LLC
- Apple Inc.
- Microsoft Corporation
- Baidu Inc.
- iFlytek Co., Ltd.
- Nuance Communications, Inc.
- Sensory, Inc.
- Cerence Inc.
- SoundHound AI, Inc.
- Verbit, Inc.
- AppTek LLC
- Speechmatics Ltd.
- ReadSpeaker Holding B.V.
- Voiceitt Ltd.
- LumenVox LLC
- AISpeech Co., Ltd.
- Deepgram, Inc.
- Picovoice Inc.
- Voxygen S.A.S.
- Uniphore Technologies Inc.
- Grit AI Inc.
- Kore.ai, Inc.
- AssemblyAI, Inc.
- Talkie.ai Sp. z o.o.
Additional Benefits:
- The market estimate (ME) sheet in Excel format
- 3 months of analyst support
TABLE OF CONTENTS
1 INTRODUCTION
- 1.1 Study Assumptions and Market Definition
- 1.2 Scope of the Study
2 RESEARCH METHODOLOGY
3 EXECUTIVE SUMMARY
4 MARKET LANDSCAPE
- 4.1 Market Overview
- 4.2 Market Drivers
- 4.2.1 Advances in Deep-Learning Speech Recognition Accuracy
- 4.2.2 On-Device Edge AI Chips Enabling Offline Voice Processing
- 4.2.3 Proliferation of Smart Speakers and Voice-First Consumer Devices
- 4.2.4 Growing Integration of VUI in Automotive Infotainment
- 4.2.5 Multimodal Foundation Models Enabling Context-Rich Voice Interactions
- 4.2.6 Open-Source Speech Corpora Lowering Entry Barriers for Niche Language Markets
- 4.3 Market Restraints
- 4.3.1 Persistent Privacy and Data-Security Concerns
- 4.3.2 Acoustic and Accent Variability Reducing Recognition Accuracy
- 4.3.3 Escalating Royalties for Proprietary Wake-Word IP in OEM Devices
- 4.3.4 EU AI Act Tier-II Transparency Mandates Inflating Compliance Overheads
- 4.4 Industry Value and Supply-Chain Analysis
- 4.5 Regulatory Landscape
- 4.6 Technological Outlook
- 4.7 Porter's Five Forces Analysis
- 4.7.1 Bargaining Power of Suppliers
- 4.7.2 Bargaining Power of Buyers
- 4.7.3 Threat of New Entrants
- 4.7.4 Threat of Substitutes
- 4.7.5 Intensity of Competitive Rivalry
- 4.8 Impact of Macroeconomic Factors on the Market
5 MARKET SIZE AND GROWTH FORECASTS (VALUE)
- 5.1 By Component
- 5.1.1 Software
- 5.1.2 Hardware
- 5.1.3 Services
- 5.2 By Deployment Mode
- 5.2.1 On-Premises
- 5.2.2 Cloud
- 5.3 By Application Vertical
- 5.3.1 Consumer Electronics
- 5.3.2 Automotive
- 5.3.3 Healthcare
- 5.3.4 BFSI
- 5.3.5 Retail and E-commerce
- 5.3.6 Education
- 5.3.7 Other Application Verticals
- 5.4 By Technology Stack
- 5.4.1 Edge AI Processing
- 5.4.2 Cloud-Based Processing
- 5.4.3 Hybrid Processing
- 5.5 By Geography
- 5.5.1 North America
- 5.5.1.1 United States
- 5.5.1.2 Canada
- 5.5.1.3 Mexico
- 5.5.2 South America
- 5.5.2.1 Brazil
- 5.5.2.2 Argentina
- 5.5.2.3 Rest of South America
- 5.5.3 Europe
- 5.5.3.1 Germany
- 5.5.3.2 United Kingdom
- 5.5.3.3 France
- 5.5.3.4 Italy
- 5.5.3.5 Spain
- 5.5.3.6 Rest of Europe
- 5.5.4 Asia-Pacific
- 5.5.4.1 China
- 5.5.4.2 Japan
- 5.5.4.3 India
- 5.5.4.4 South Korea
- 5.5.4.5 ASEAN
- 5.5.4.6 Rest of Asia-Pacific
- 5.5.5 Middle East and Africa
- 5.5.5.1 Middle East
- 5.5.5.1.1 Saudi Arabia
- 5.5.5.1.2 United Arab Emirates
- 5.5.5.1.3 Turkey
- 5.5.5.1.4 Rest of Middle East
- 5.5.5.2 Africa
- 5.5.5.2.1 South Africa
- 5.5.5.2.2 Nigeria
- 5.5.5.2.3 Rest of Africa
- 5.5.5.1 Middle East
- 5.5.1 North America
6 COMPETITIVE LANDSCAPE
- 6.1 Market Concentration
- 6.2 Strategic Moves
- 6.3 Market Share Analysis
- 6.4 Company Profiles (includes Global Level Overview, Market Level Overview, Core Segments, Financials as available, Strategic Information, Market Rank/Share, Products and Services, Recent Developments)
- 6.4.1 Amazon.com, Inc.
- 6.4.2 Google LLC
- 6.4.3 Apple Inc.
- 6.4.4 Microsoft Corporation
- 6.4.5 Baidu Inc.
- 6.4.6 iFlytek Co., Ltd.
- 6.4.7 Nuance Communications, Inc.
- 6.4.8 Sensory, Inc.
- 6.4.9 Cerence Inc.
- 6.4.10 SoundHound AI, Inc.
- 6.4.11 Verbit, Inc.
- 6.4.12 AppTek LLC
- 6.4.13 Speechmatics Ltd.
- 6.4.14 ReadSpeaker Holding B.V.
- 6.4.15 Voiceitt Ltd.
- 6.4.16 LumenVox LLC
- 6.4.17 AISpeech Co., Ltd.
- 6.4.18 Deepgram, Inc.
- 6.4.19 Picovoice Inc.
- 6.4.20 Voxygen S.A.S.
- 6.4.21 Uniphore Technologies Inc.
- 6.4.22 Grit AI Inc.
- 6.4.23 Kore.ai, Inc.
- 6.4.24 AssemblyAI, Inc.
- 6.4.25 Talkie.ai Sp. z o.o.
7 MARKET OPPORTUNITIES AND FUTURE OUTLOOK
- 7.1 White-space and Unmet-Need Assessment

